
Task template · Everyone with data
Interactive chart
A live chart you can share by link. Made from one message, so you can get your own in minutes.
Interactive chart
- Uses
- Interactive widgets
- You need
- Paste or attach your numbers
Prompt: Create an interactive chart dashboard from this data: [paste data or attach a file]. Show [chart types, e.g. a monthly trend line and a breakdown by category], with filters for [fields] and hover tooltips.
A live chart you can share by link. For Everyone with data.
The prompt
Create an interactive chart dashboard from this data: larkspur_sales_2025.csv, 1,284 orders with month, region, product line, sales channel and revenue. Show a monthly revenue trend line and a donut breakdown by product line, with filters for region and sales channel and hover tooltips.
You need: Paste or attach your numbers
Uses: Interactive widgets
Make it yours
- Change the details in the prompt to fit everyone with data.
- Ask for edits in plain words: tone, colors, length, layout or data.
- Share the result by link or export it when you are done.
More task templates
Browse all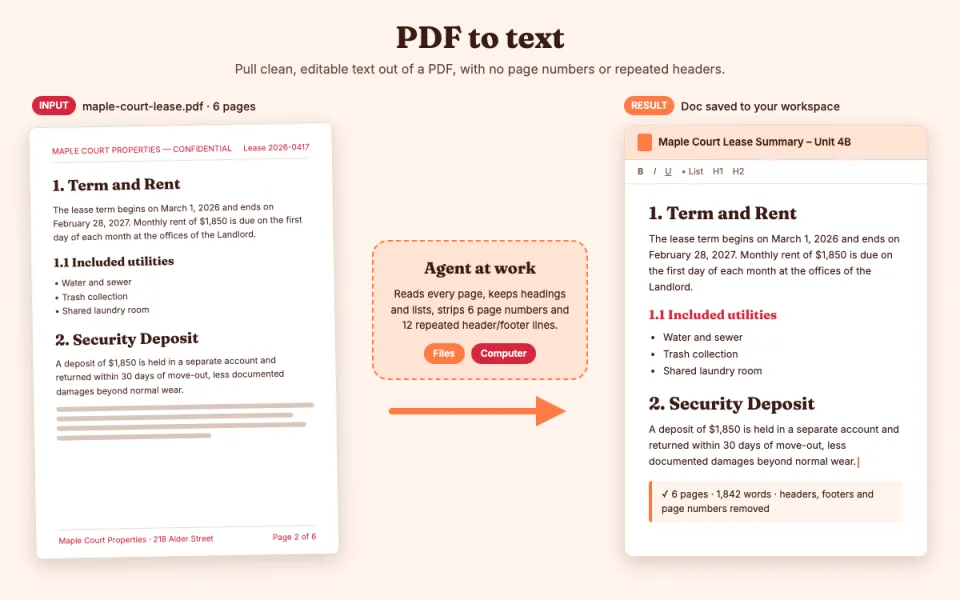
PDF to text
Pull clean, editable text out of a PDF
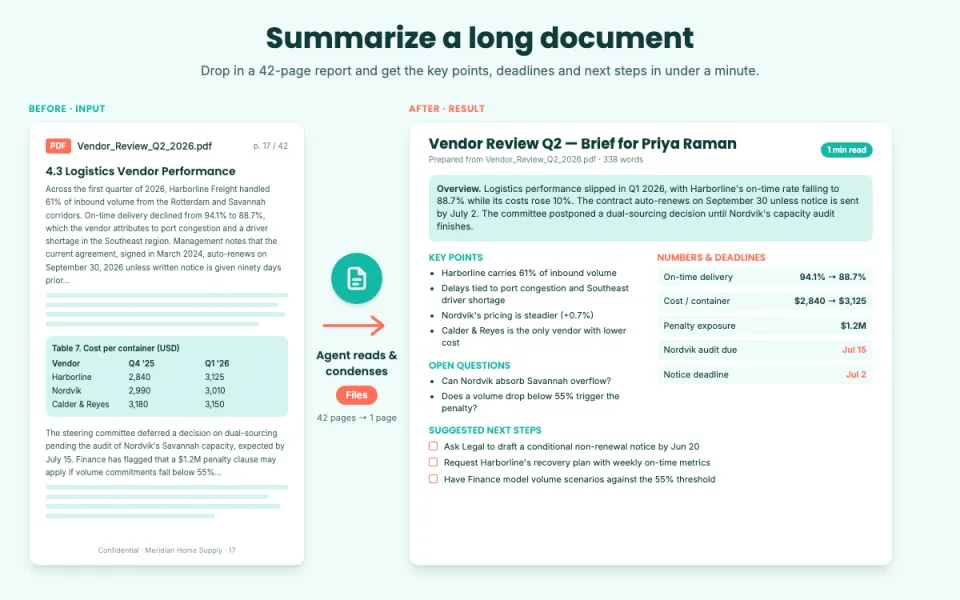
Summarize a long document
Key points, decisions and action items
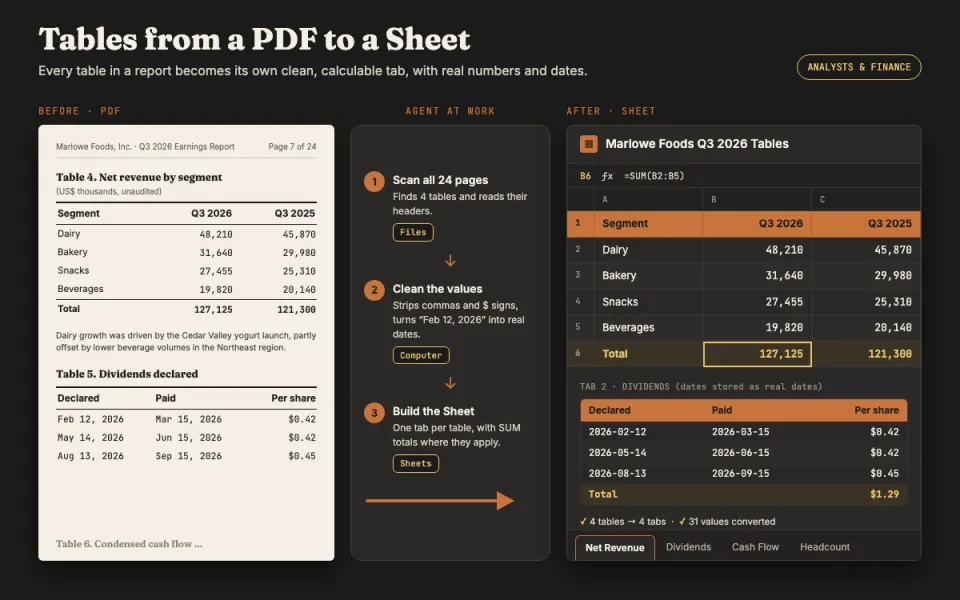
Tables from a PDF to a Sheet
Turn report tables into a spreadsheet
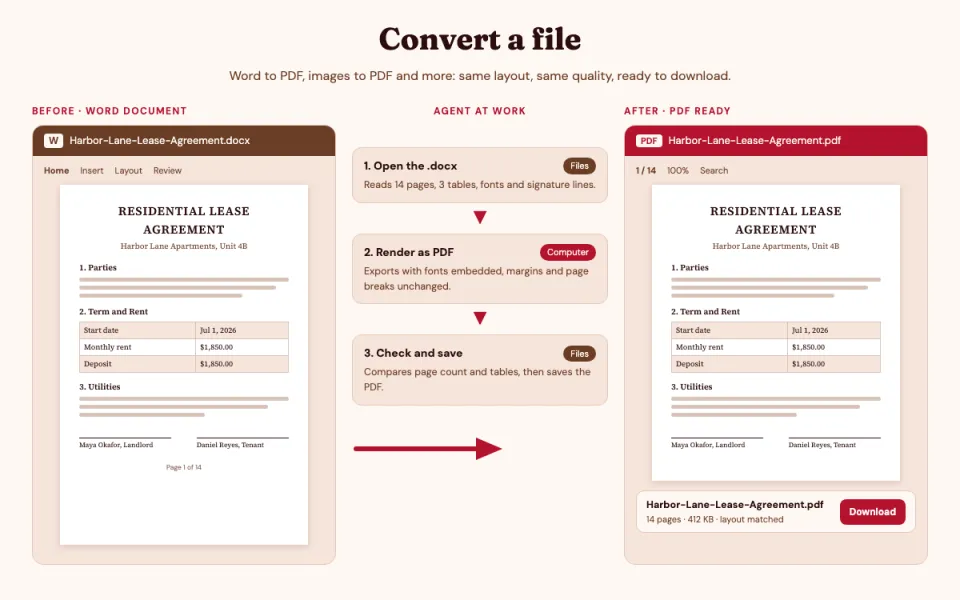
Convert a file
Word to PDF, images to PDF and more
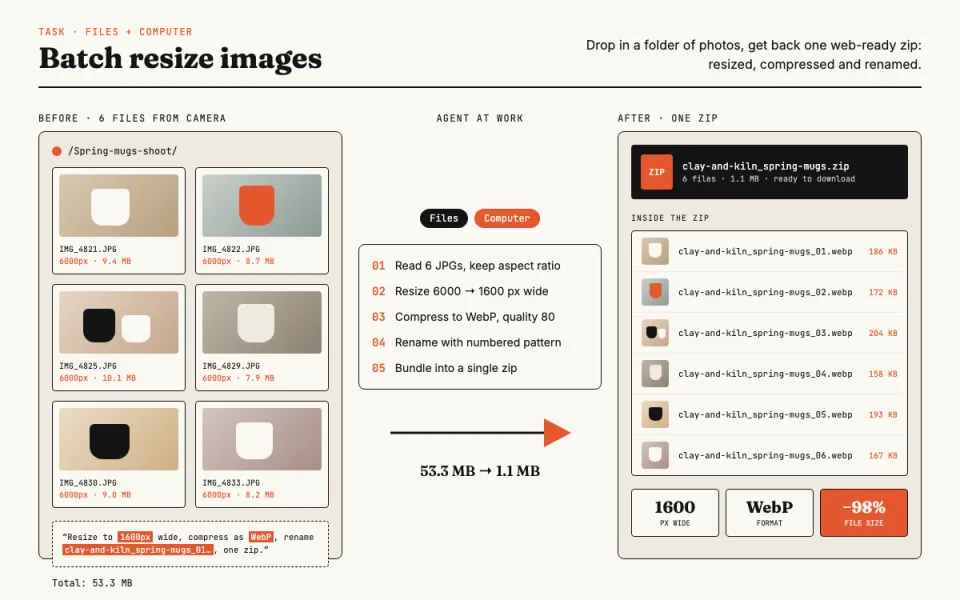
Batch resize images
Resize, compress and rename photos
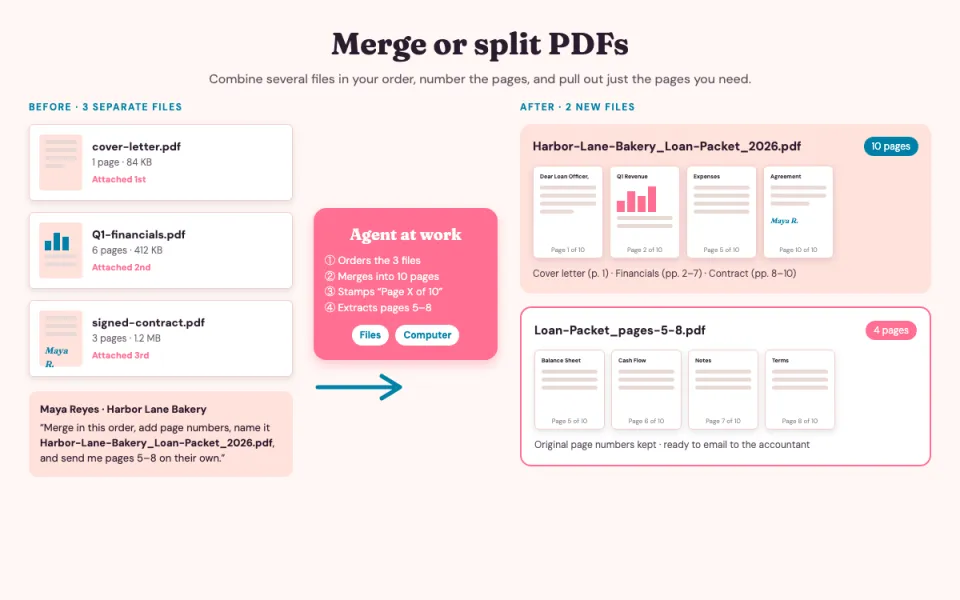
Merge or split PDFs
Combine files or pull out pages