Visualization template · Savers & students
Savings growth calculator
See compound interest over time. Made from one message, so you can get your own in minutes.
Savings growth calculator
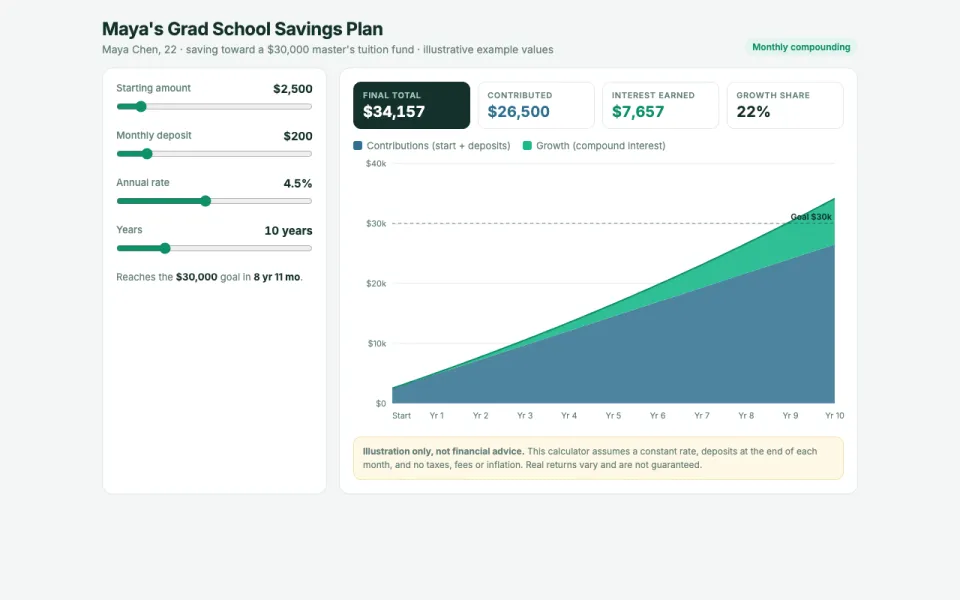
See compound interest over time
The prompt
Create an interactive chart that shows how savings grow with compound interest. Sliders for starting amount ($2,500), monthly deposit, annual rate and years; an area chart of contributions vs growth; and the final total. Add a note that it is an illustration, not financial advice.
Make it yours
- Change the details in the prompt to fit savers & students.
- For example, change it so that it is for a couple saving for a house down payment, starting at $12,000 and the sliders default to a $600 monthly deposit, a 4.5% rate and 8 years, with a goal line at $60,000.
- Ask for edits in plain words: tone, colors, length, layout or data.
- Share the result by link or export it when you are done.