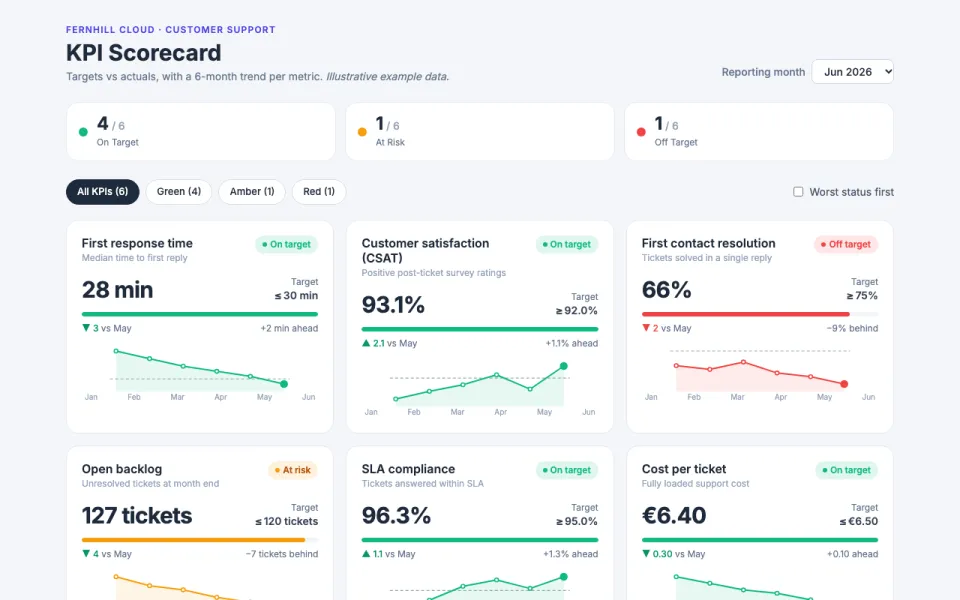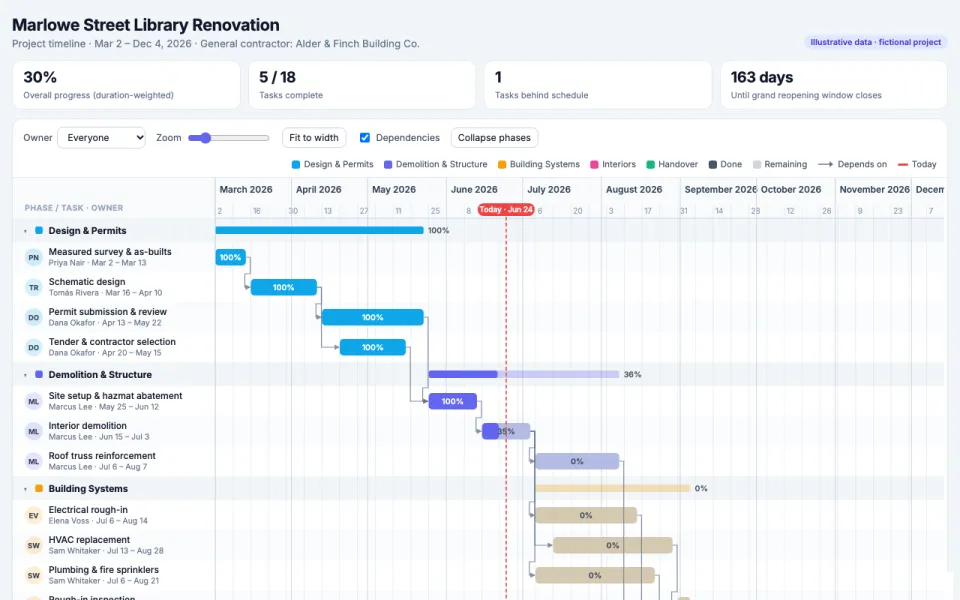
Visualization template · Sales & business owners
Sales dashboard
Revenue, regions and top products. Made from one message, so you can get your own in minutes.
Sales dashboard
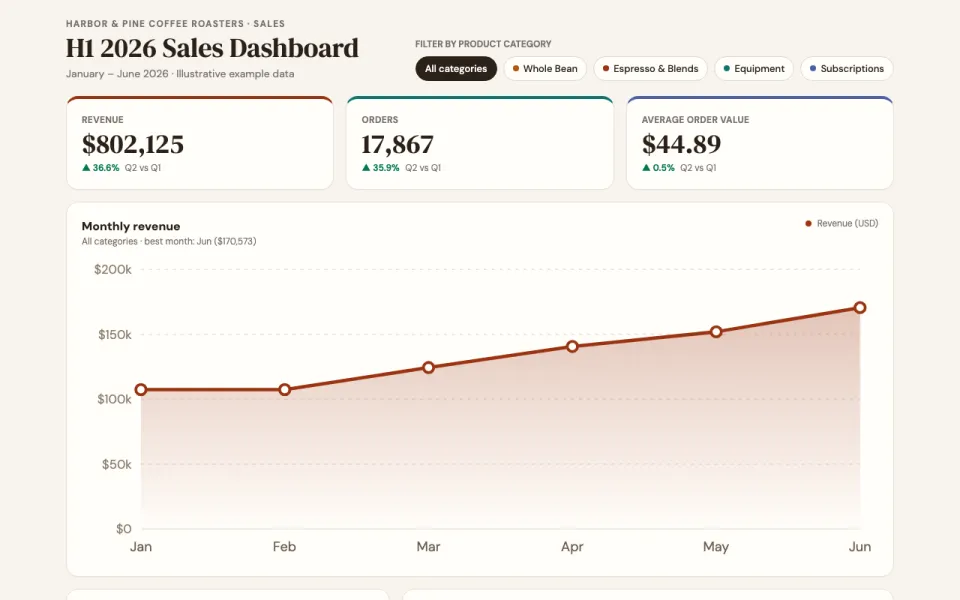
Revenue, regions and top products
The prompt
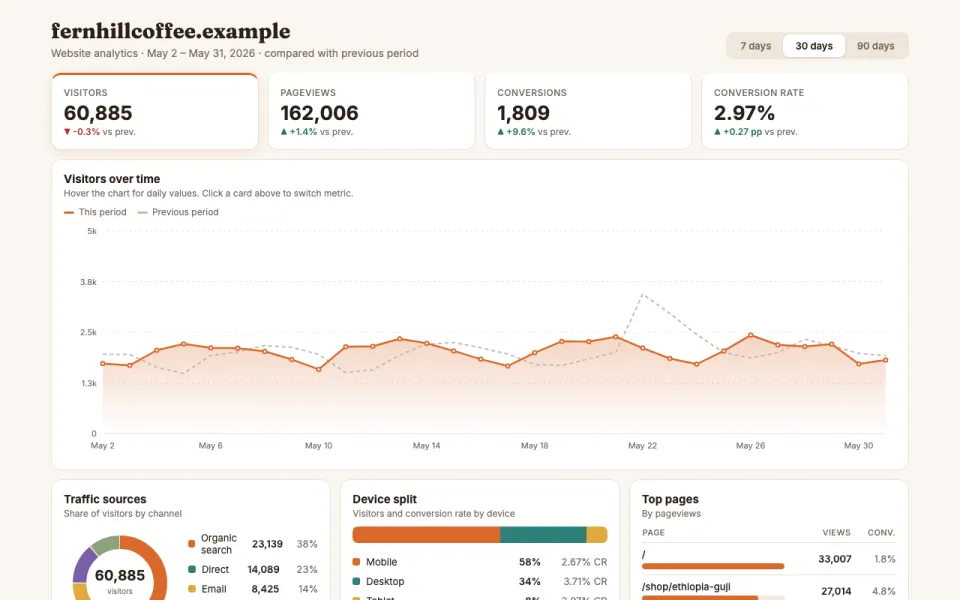
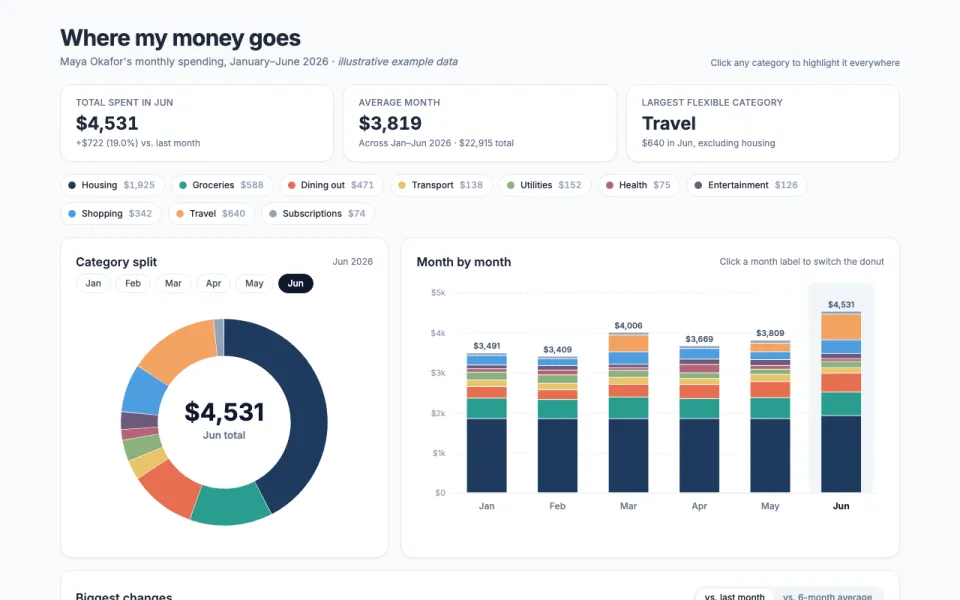
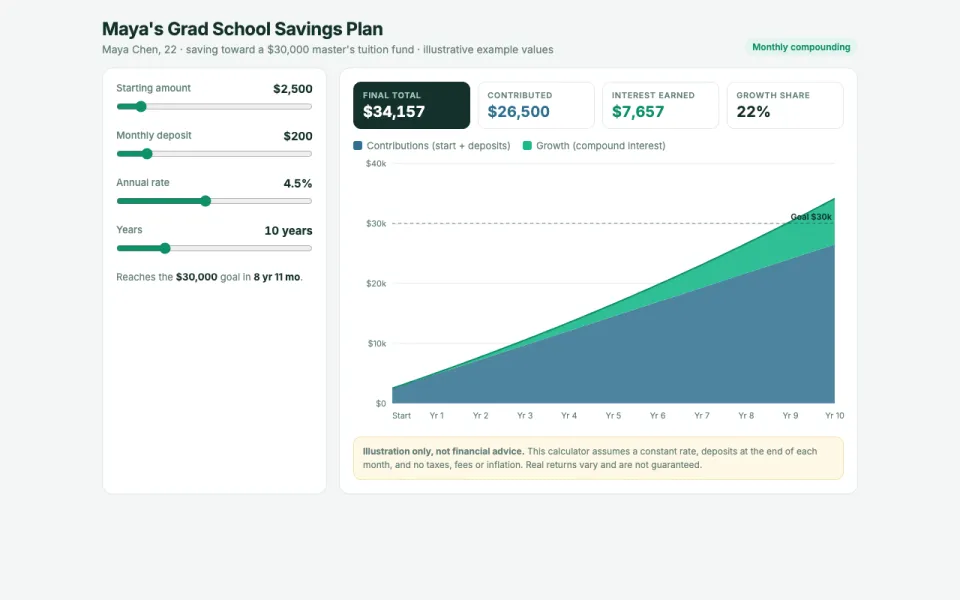
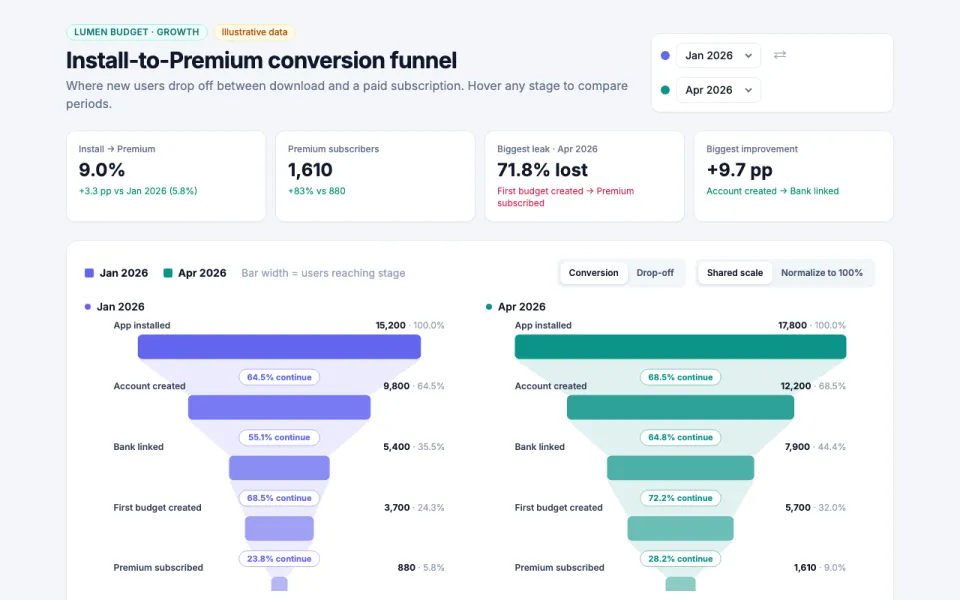
Create an interactive dashboard chart for Harbor & Pine Coffee Roasters sales over January–June 2026: KPI cards (revenue, orders, average order value), a monthly revenue trend, revenue by region, and a top products table, with a filter for product category (Whole Bean, Espresso & Blends, Equipment, Subscriptions). Use this data: example data.
Make it yours
- Change the details in the prompt to fit sales & business owners.
- For example, change it so that it is for a vegan donut shop in Austin with sales from July–December 2026 and revenue is broken down by sales channel (storefront, delivery apps, catering) with a filter for donut type.
- Ask for edits in plain words: tone, colors, length, layout or data.
- Share the result by link or export it when you are done.