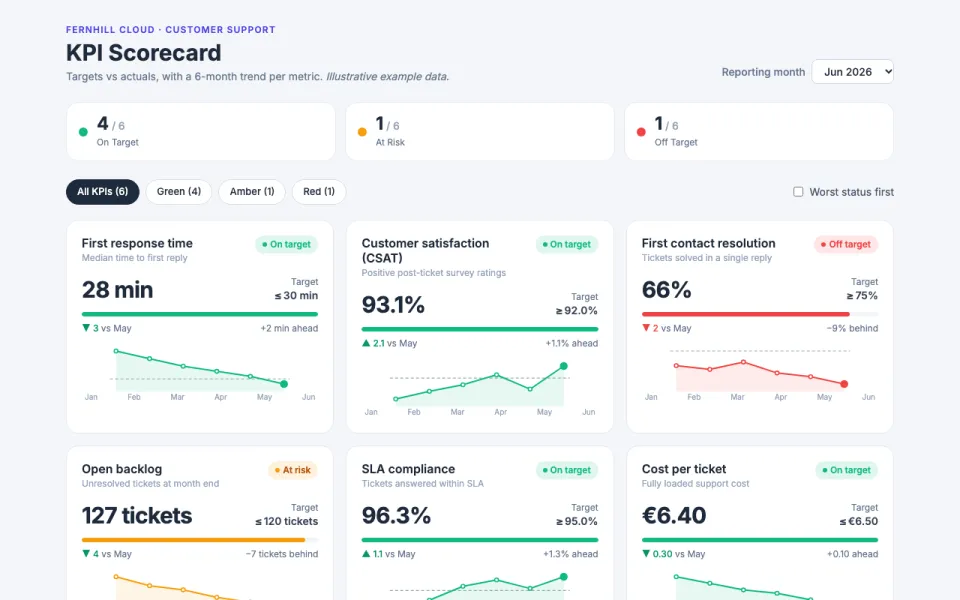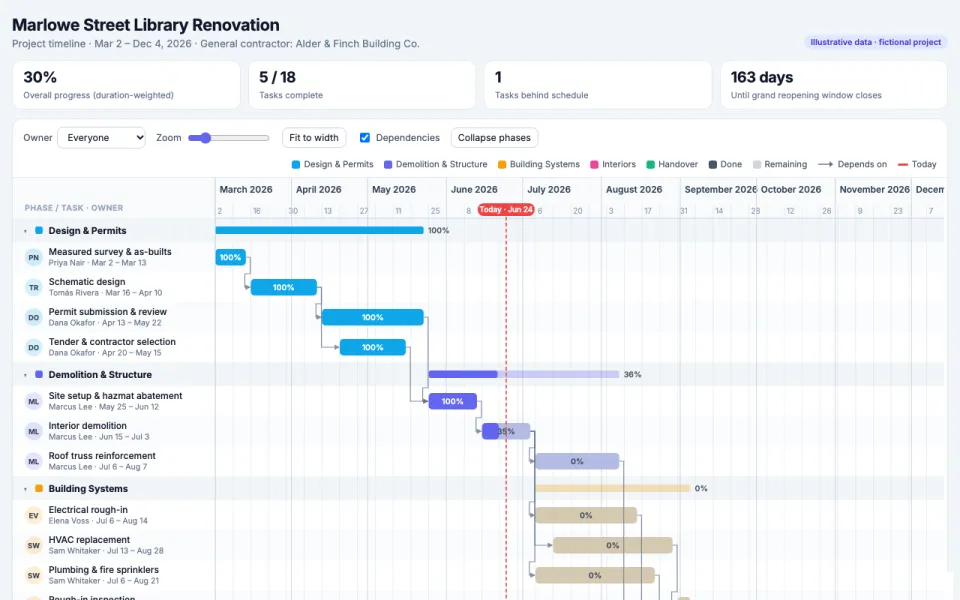
Visualization template · Marketers
Website analytics
Traffic, sources and conversions. Made from one message, so you can get your own in minutes.
Website analytics
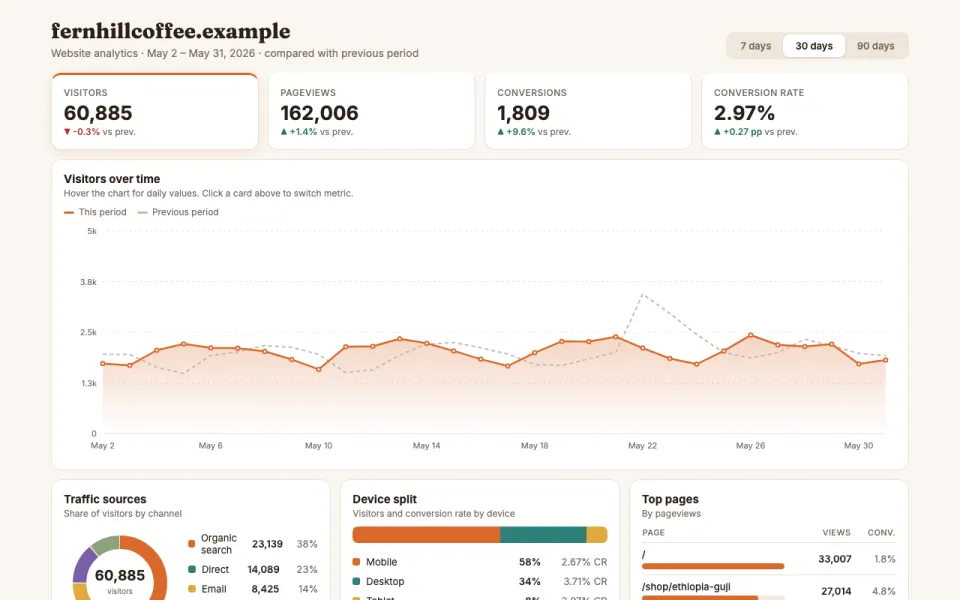
Traffic, sources and conversions
The prompt
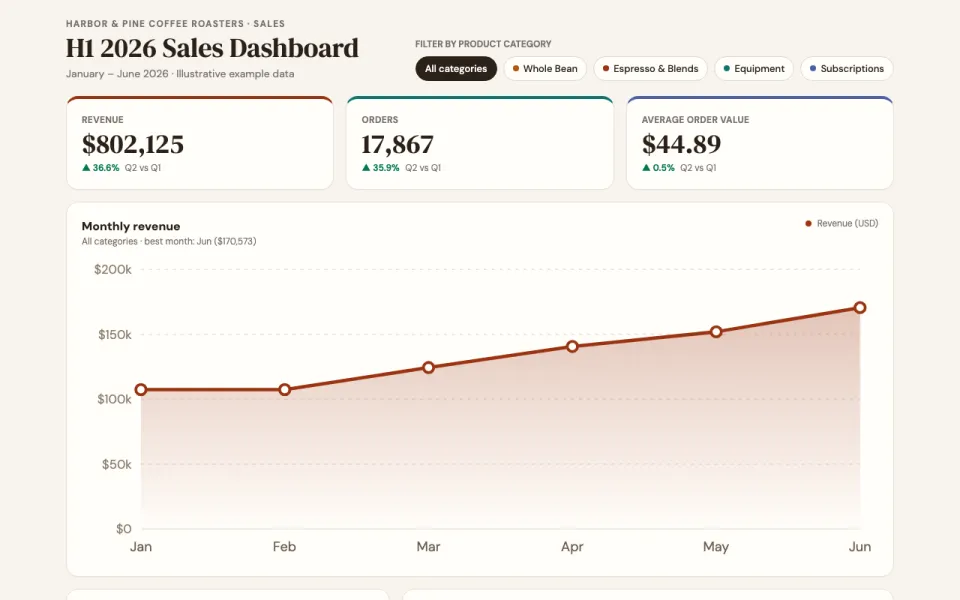
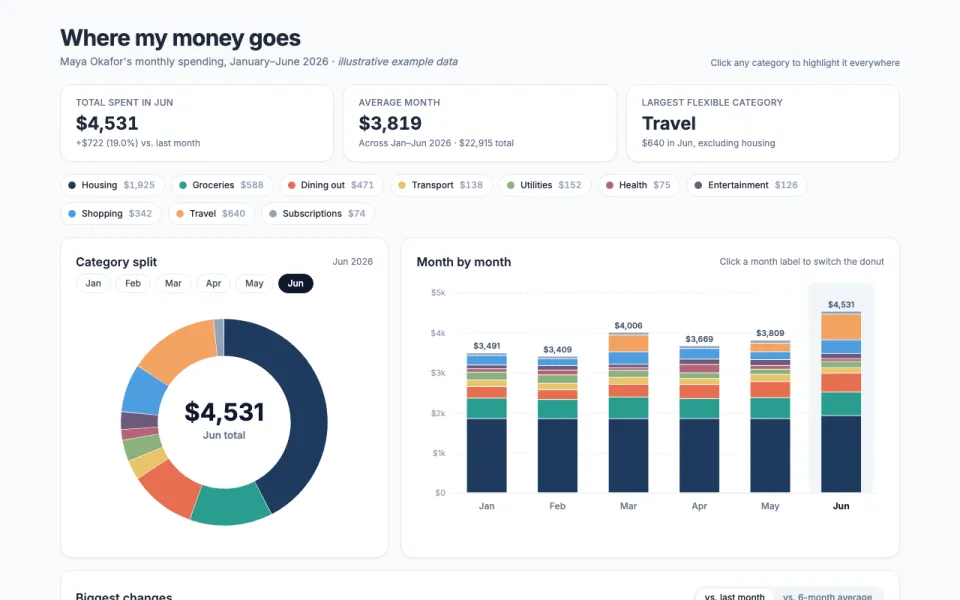
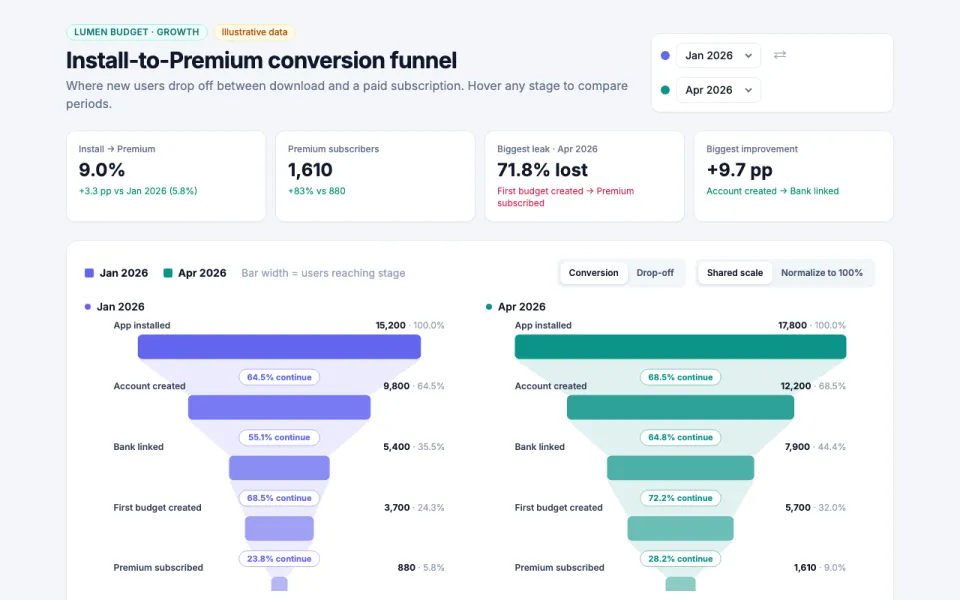
Create an interactive dashboard chart of website analytics for fernhillcoffee.example (Fernhill Coffee Roasters, an online specialty coffee shop with a subscription program) over the last 90 days, March 3 to May 31, 2026: visitors over time, traffic sources, top pages, device split and conversion rate, with a date range toggle (7, 30 and 90 days) and comparison to the previous period. Data: example data.
Make it yours
- Change the details in the prompt to fit marketers.
- For example, change it so that it is for a boutique yoga studio's booking site, trailfloweryoga.example and the date range toggle covers 14, 60 and 180 days, with conversion rate tracking class sign-ups instead of purchases.
- Ask for edits in plain words: tone, colors, length, layout or data.
- Share the result by link or export it when you are done.