
Visualization template · Developers & tech buyers
AI model comparison
Scores, speed and price side by side. Made from one message, so you can get your own in minutes.
AI model comparison
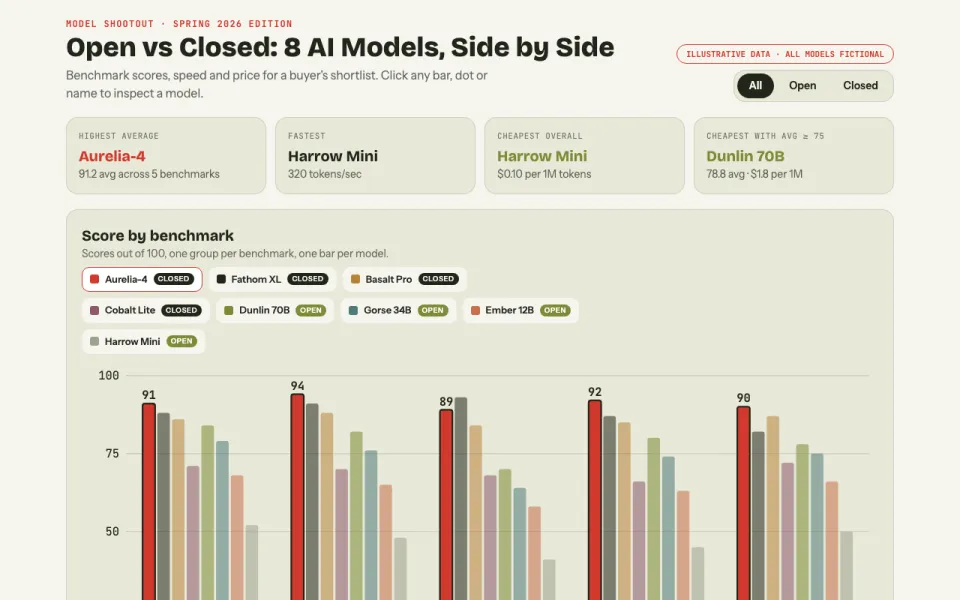
Scores, speed and price side by side
The prompt
Create an interactive chart comparing 8 fictional AI models on coding, reasoning, vision, math and tool use: grouped bars per benchmark, a speed versus price scatter, a radar for the selected model, and filters for open versus closed models. Label all data as illustrative.
Make it yours
- Change the details in the prompt to fit developers & tech buyers.
- For example, change it so that it compares 6 fictional speech and translation models on transcription accuracy, latency and accent robustness and the price axis shows cost per audio hour instead of per million tokens.
- Ask for edits in plain words: tone, colors, length, layout or data.
- Share the result by link or export it when you are done.





