
Visualization template · Communities & health teams
Air quality dashboard
Pollution levels across a city. Made from one message, so you can get your own in minutes.
Air quality dashboard
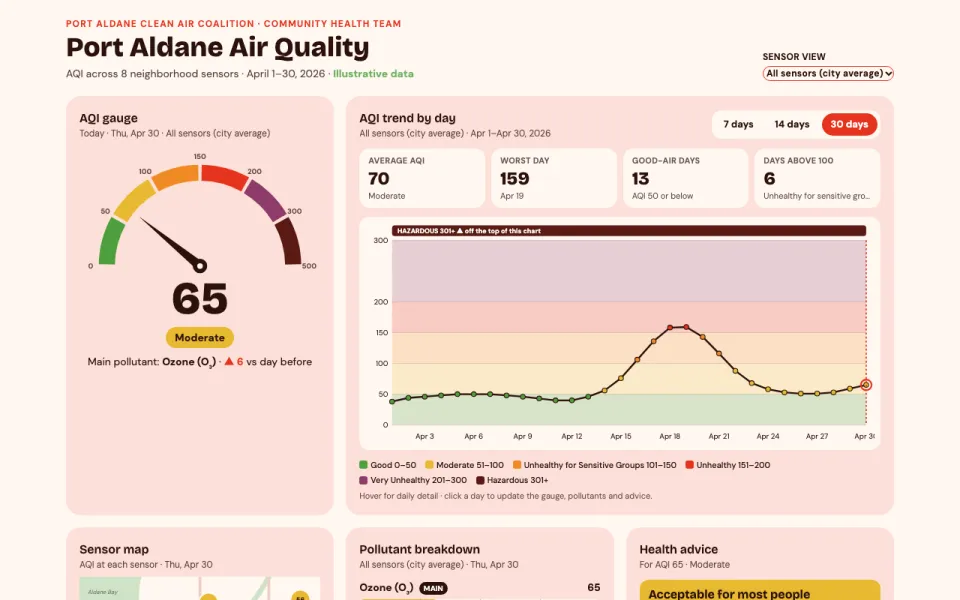
Pollution levels across a city
The prompt
Create an interactive dashboard chart of air quality in Port Aldane over April 2026 (April 1–30): an AQI gauge for today, a trend line with color bands from good to hazardous, sensor locations on a simple map, a pollutant breakdown, and health advice for the current level. Use illustrative data.
Make it yours
- Change the details in the prompt to fit communities & health teams.
- For example, change it so that it tracks a mountain valley town hit by wildfire smoke and the period is the July–August 2026 fire season.
- Ask for edits in plain words: tone, colors, length, layout or data.
- Share the result by link or export it when you are done.





