
Visualization template · Teachers & data storytellers
Animated bubble chart
Watch countries move over decades. Made from one message, so you can get your own in minutes.
Animated bubble chart
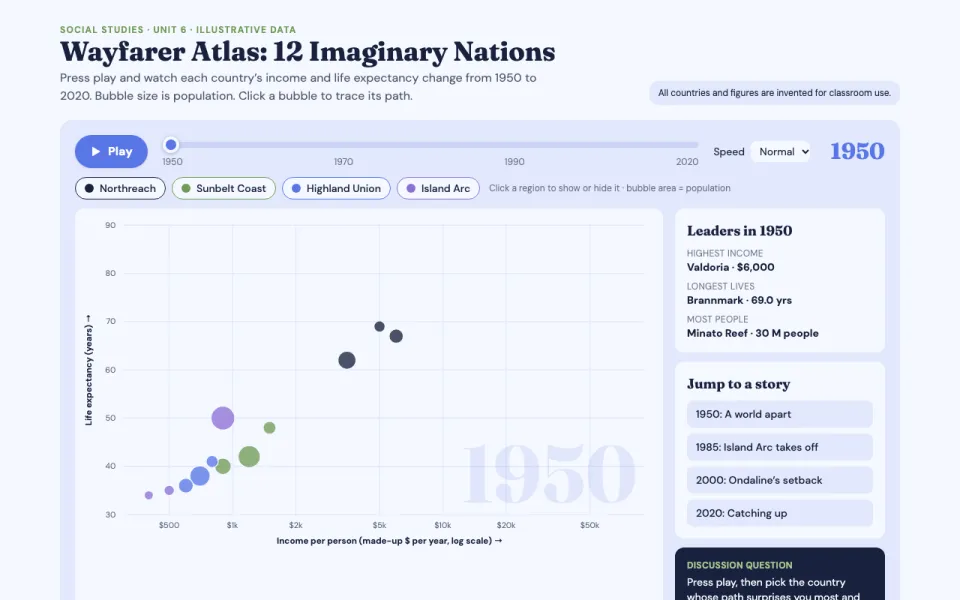
Watch countries move over decades
The prompt
Create an animated bubble chart visualization of income per person versus life expectancy for 12 fictional countries from 1950 to 2020, bubbles sized by population and colored by region, with a play button, a year slider and hover labels.
Make it yours
- Change the details in the prompt to fit teachers & data storytellers.
- For example, change it so that so that it compares 15 countries on literacy rate versus child mortality and the timeline runs from 1980 to 2040 with a projection shaded after 2026.
- Ask for edits in plain words: tone, colors, length, layout or data.
- Share the result by link or export it when you are done.





