
Visualization template · Finance teams
Budget waterfall
From plan to actual, step by step. Made from one message, so you can get your own in minutes.
Budget waterfall
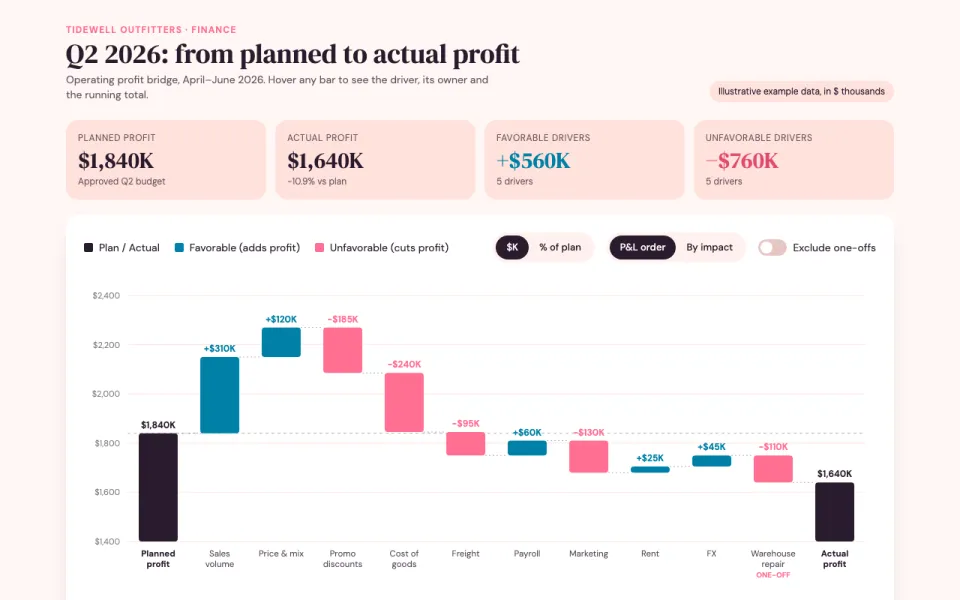
From plan to actual, step by step
The prompt
Create an interactive waterfall chart for Tidewell Outfitters, a regional surf-apparel retailer, showing how planned Q2 2026 operating profit of $1,840K moves to the actual result through sales volume, price and mix, promo discounts, cost of goods, freight, payroll, marketing, rent, FX and a one-off warehouse repair, with increases and decreases colored and values on hover. Data: example data.
Make it yours
- Change the details in the prompt to fit finance teams.
- For example, change it so that it is for a regional bakery chain and the starting figure is planned revenue, with drivers like store traffic, ticket size and wholesale orders.
- Ask for edits in plain words: tone, colors, length, layout or data.
- Share the result by link or export it when you are done.





