
Visualization template · Sustainability teams
Carbon footprint breakdown
Emissions by source and scope. Made from one message, so you can get your own in minutes.
Carbon footprint breakdown
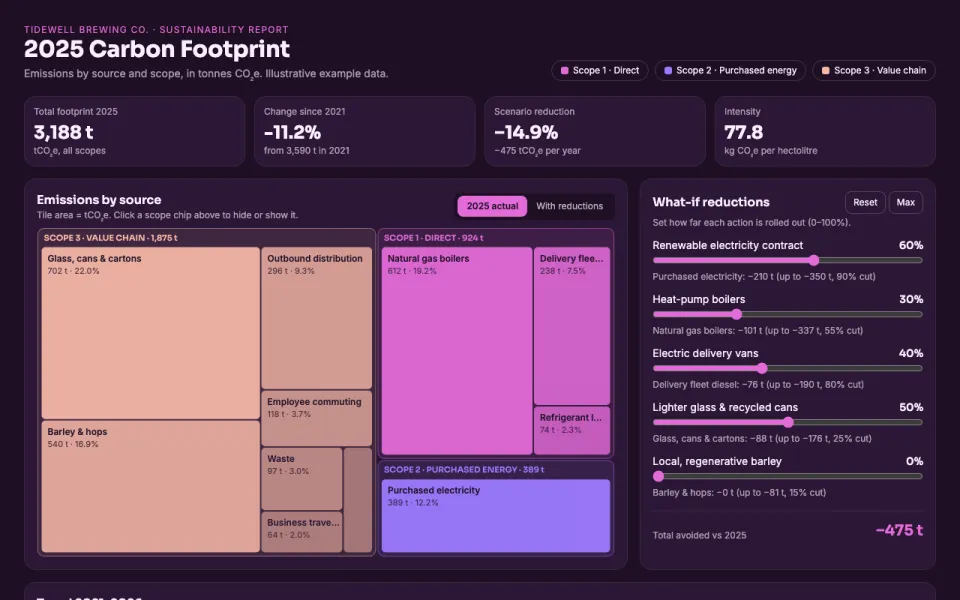
Emissions by source and scope
The prompt
Create an interactive chart of Tidewell Brewing Co.'s carbon footprint for 2025: emissions by source as a treemap, trend over time, and a what-if panel for reductions like switching to a renewable electricity contract, replacing gas boilers with heat pumps, electrifying the delivery fleet, lighter glass and recycled-content cans, and local barley sourcing. Data: example data (3,188 tCO2e total across Scope 1, 2 and 3, with 2021–2025 history).
Make it yours
- Change the details in the prompt to fit sustainability teams.
- For example, change it so that it is for a 40-person architecture studio in Rotterdam with mostly Scope 3 emissions and the what-if panel tests cutting flights and switching to a green-power office lease.
- Ask for edits in plain words: tone, colors, length, layout or data.
- Share the result by link or export it when you are done.





