
Visualization template · Travelers & teachers
Climate comparison
Compare weather between cities. Made from one message, so you can get your own in minutes.
Climate comparison
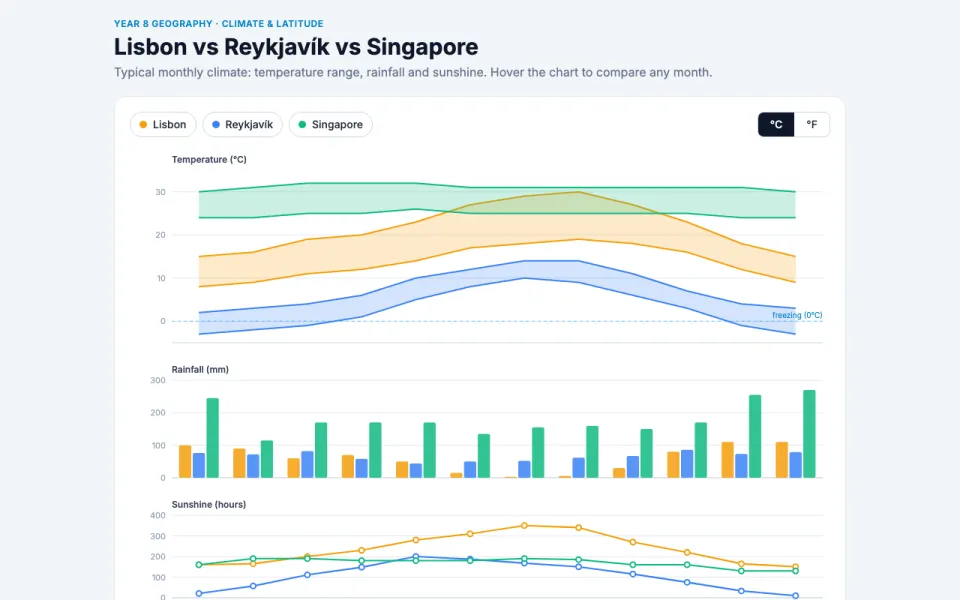
Compare weather between cities
The prompt
Create an interactive chart comparing the typical climate of Lisbon, Reykjavík and Singapore by month: temperature ranges as bands, rainfall as bars, and sunshine hours, with a toggle between Celsius and Fahrenheit. Use typical climate averages. This is for a Year 8 geography lesson on how latitude and ocean currents shape climate, so make the differences between a temperate Atlantic city, a subpolar island capital and an equatorial city easy to see.
Make it yours
- Change the details in the prompt to fit travelers & teachers.
- For example, change it so that it is for a family planning a two-week trip in October and it compares Kyoto, Cape Town and Vancouver, with a highlight on the months that are best for hiking.
- Ask for edits in plain words: tone, colors, length, layout or data.
- Share the result by link or export it when you are done.





