
Visualization template · Engineering & ops teams
Kanban flow chart
Work in progress and cycle time. Made from one message, so you can get your own in minutes.
Kanban flow chart
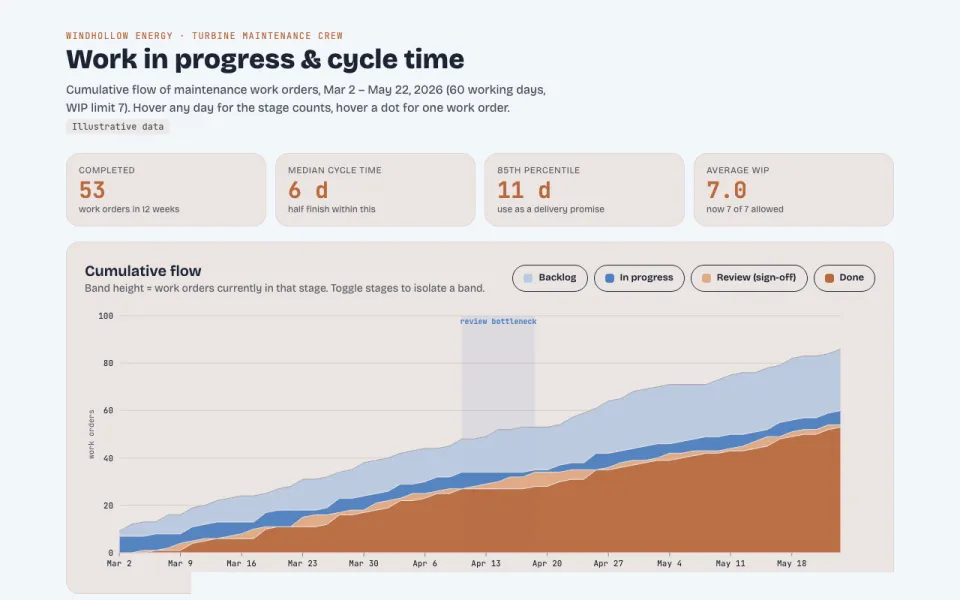
Work in progress and cycle time
The prompt
Create an interactive cumulative flow chart for the Windhollow Energy turbine maintenance crew over 12 weeks (Mar 2 to May 22, 2026) with stacked bands for backlog, in progress, review (inspector sign-off) and done, a cycle time scatter below, hover details per day, and a toggle to hide stages. Data: example data.
Make it yours
- Change the details in the prompt to fit engineering & ops teams.
- For example, change it so that it is for a hospital biomedical-equipment repair team and the stages are triage, repair, calibration and returned to ward.
- Ask for edits in plain words: tone, colors, length, layout or data.
- Share the result by link or export it when you are done.





