
Visualization template · Science classes
Earthquake activity map
Quakes by size and time. Made from one message, so you can get your own in minutes.
Earthquake activity map
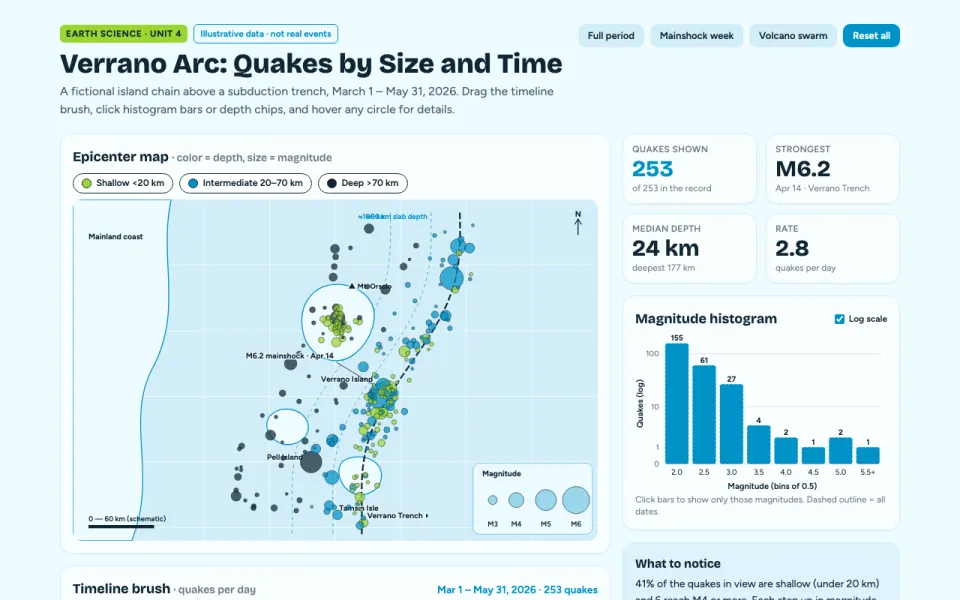
Quakes by size and time
The prompt
Create an interactive visualization of earthquakes in the Verrano Arc, a fictional island chain above a subduction trench over March 1 – May 31, 2026 using illustrative data: circles on a simplified map sized by magnitude, a timeline brush to filter dates, a magnitude histogram, and hover details with depth and time.
Make it yours
- Change the details in the prompt to fit science classes.
- For example, change it so that so that it shows a fictional rift valley with only shallow quakes and the period is January to December 2026.
- Ask for edits in plain words: tone, colors, length, layout or data.
- Share the result by link or export it when you are done.





