
Visualization template · Newsrooms & civics classes
Election results
Seats, vote share and swing. Made from one message, so you can get your own in minutes.
Election results
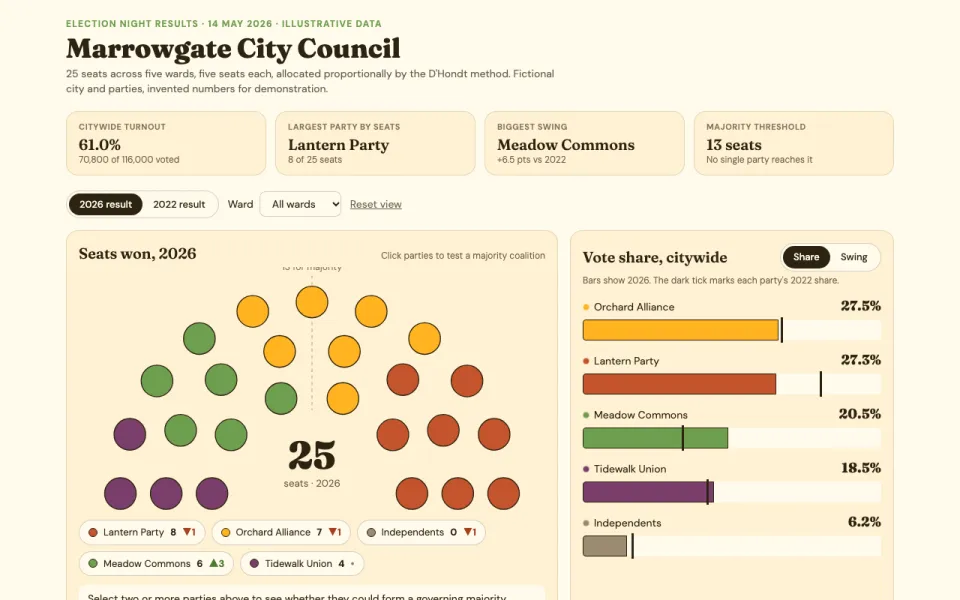
Seats, vote share and swing
The prompt
Create an interactive election results visualization for the fictional Marrowgate City Council election of 14 May 2026 with 25 seats: a half-circle seat chart colored by party, vote share bars, the swing from last time, and a district table with hover details. Use clearly fictional parties: Lantern Party, Orchard Alliance, Meadow Commons, Tidewalk Union and Independents.
Make it yours
- Change the details in the prompt to fit newsrooms & civics classes.
- For example, change it so that it covers a fictional 31-seat county board with six wards and the swing compares against the 2018 election instead of 2022.
- Ask for edits in plain words: tone, colors, length, layout or data.
- Share the result by link or export it when you are done.





