
Visualization template · Homeowners
Home energy usage
Which appliances cost the most. Made from one message, so you can get your own in minutes.
Home energy usage
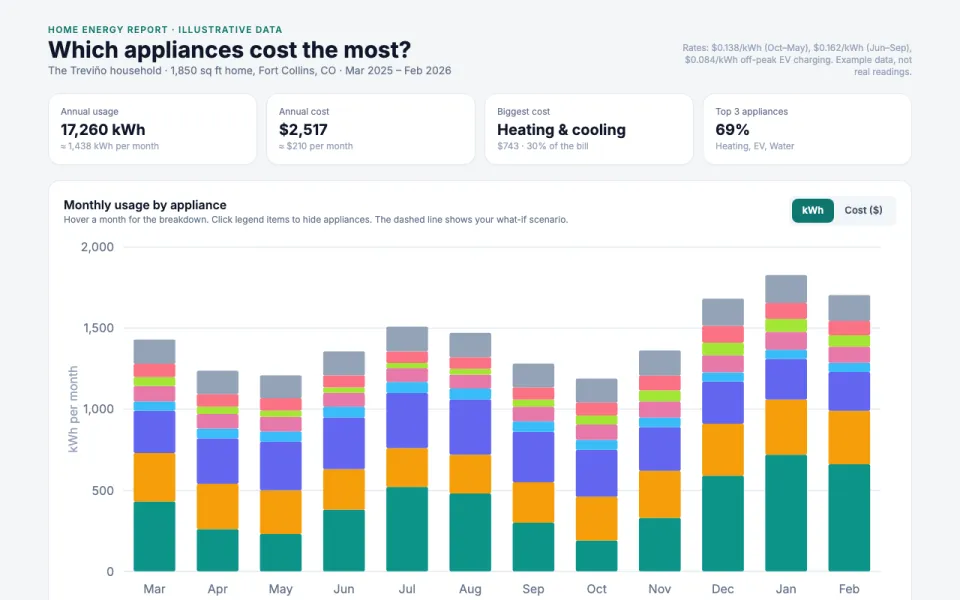
Which appliances cost the most
The prompt
Create an interactive chart of home energy usage: monthly kWh and cost, usage by appliance (heating & cooling, water heater, EV charger, refrigerator, laundry, lighting, cooking & dishwasher, electronics & other), and a what-if slider showing savings from changes like lowering the thermostat setpoint, switching to a heat pump water heater, converting to LED bulbs, shifting EV charging to off-peak hours, and air-drying laundry. Data: example data for a 1,850 sq ft home in Fort Collins, CO, March 2025 to February 2026, at $0.138/kWh (Oct–May), $0.162/kWh (Jun–Sep), and $0.084/kWh off-peak.
Make it yours
- Change the details in the prompt to fit homeowners.
- For example, change it so that it is for a 2,400 sq ft home in Phoenix, AZ with a pool pump and rooftop solar and the what-if slider tests raising the AC setpoint, adding attic insulation, and running the pool pump overnight.
- Ask for edits in plain words: tone, colors, length, layout or data.
- Share the result by link or export it when you are done.





