
Visualization template · Gardeners
Garden season timeline
When to sow, grow and harvest. Made from one message, so you can get your own in minutes.
Garden season timeline
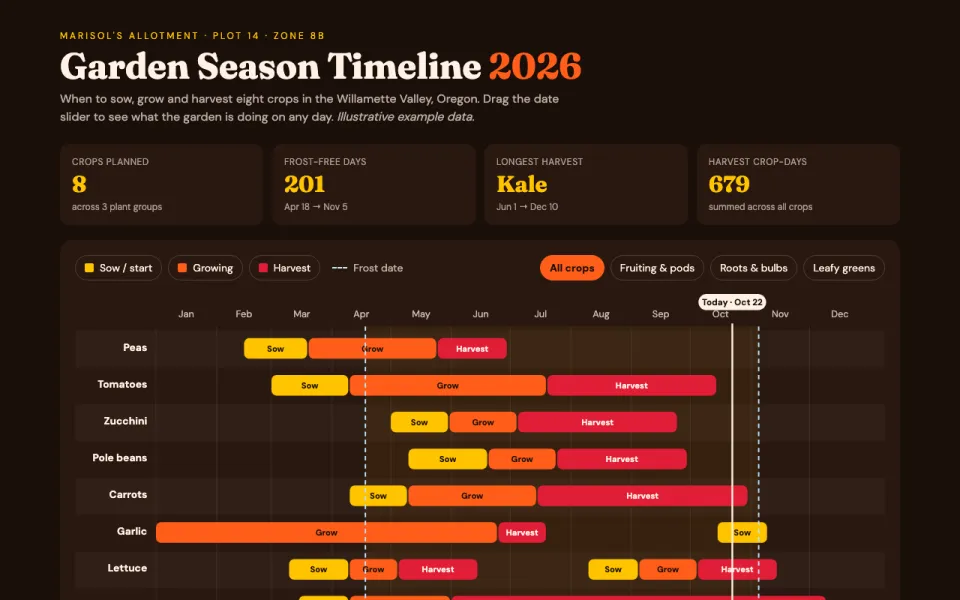
When to sow, grow and harvest
The prompt
Create an interactive timeline chart of my garden season for tomatoes, zucchini, pole beans, peas, carrots, garlic, lettuce and kale in the Willamette Valley, Oregon (USDA zone 8b): sowing, growing and harvest windows as colored bars by month, frost dates marked (last spring frost April 18, first fall frost November 5), and a today line. Data: example data.
Make it yours
- Change the details in the prompt to fit gardeners.
- For example, change it so that it is for a balcony herb and salad garden in Chicago, zone 6a, with a last frost of May 5 and a first frost of October 15 and the crops are basil, cherry tomatoes, radishes, spinach and chives.
- Ask for edits in plain words: tone, colors, length, layout or data.
- Share the result by link or export it when you are done.





