
Visualization template · Teachers
Grade distribution
Class results and outliers. Made from one message, so you can get your own in minutes.
Grade distribution
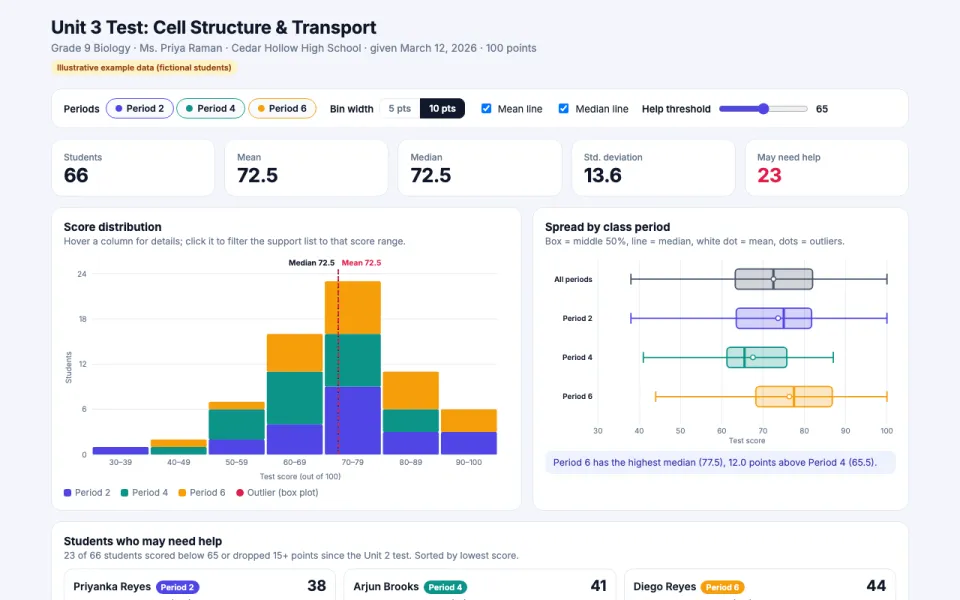
Class results and outliers
The prompt
Create an interactive chart of test results for Ms. Priya Raman's Grade 9 Biology classes (Periods 2, 4 and 6, 66 students) on the Unit 3 test, Cell Structure and Transport (100 points, given March 12, 2026): a histogram of scores, average and median lines, a box plot by class period, and a list of students who may need help (score below 65 or a drop of 15+ points from the Unit 2 test). Data: example data, with 66 Unit 3 scores and each student's Unit 2 score for comparison.
Make it yours
- Change the details in the prompt to fit teachers.
- For example, change it so that the chart is for Mr. Daniel Okafor's Grade 11 Algebra II classes (Periods 1 and 3, 48 students) on the Chapter 5 quiz on quadratic functions, the box plot is grouped by seating section instead of class period, and the help list flags students scoring below 70 or whose grade fell 10+ points from the Chapter 4 quiz.
- Ask for edits in plain words: tone, colors, length, layout or data.
- Share the result by link or export it when you are done.





