
Visualization template · Marketers
Marketing channel mix
Which channels drive results. Made from one message, so you can get your own in minutes.
Marketing channel mix
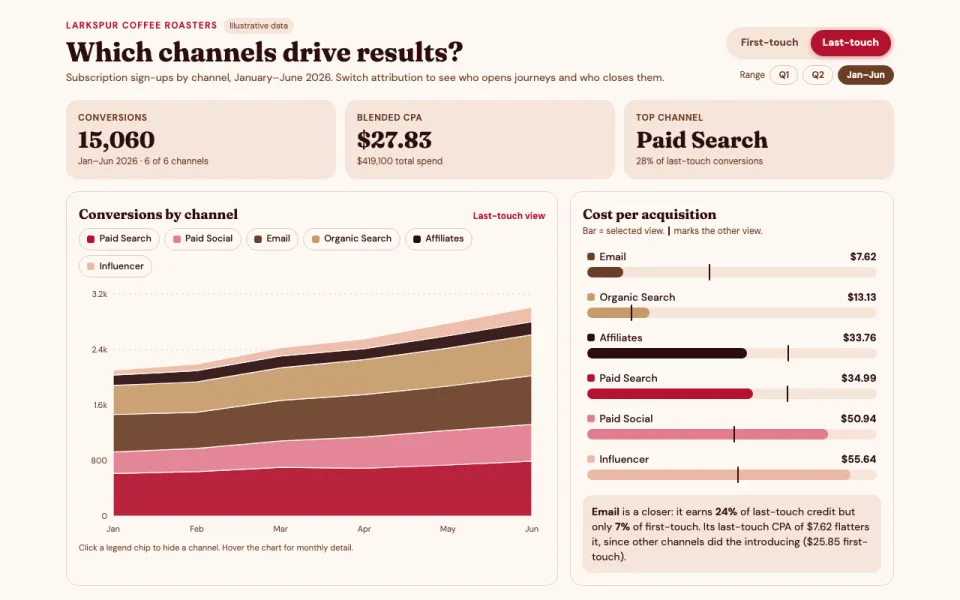
Which channels drive results
The prompt
Create an interactive chart of marketing performance for Larkspur Coffee Roasters over January–June 2026: stacked area of conversions by channel, cost per acquisition by channel, and a toggle between first-touch and last-touch views. Data: example data for six channels (Paid Search, Paid Social, Email, Organic Search, Affiliates, Influencer) with monthly conversions under both attribution models and monthly spend.
Make it yours
- Change the details in the prompt to fit marketers.
- For example, change it so that it is for a B2B project-management app with a 90-day sales cycle and the chart is weekly across Q3 2026 with webinars and LinkedIn Ads as channels.
- Ask for edits in plain words: tone, colors, length, layout or data.
- Share the result by link or export it when you are done.





