
Visualization template · Finance & households
Money flow (Sankey)
Income to spending in one picture. Made from one message, so you can get your own in minutes.
Money flow (Sankey)
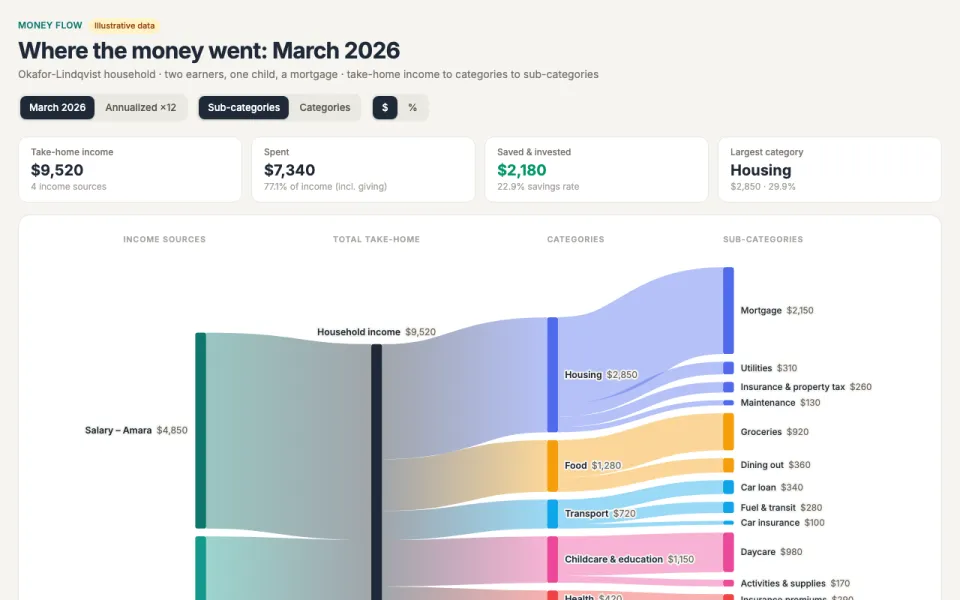
Income to spending in one picture
The prompt
Create an interactive Sankey chart showing how the Okafor-Lindqvist household's monthly take-home income ($9,520 from two net salaries, freelance design work and interest/dividends) flows into Housing, Food, Transport, Childcare & education, Health, Lifestyle, Savings & investing and Giving and sub-categories (e.g. Mortgage, Groceries, Daycare, Retirement) for March 2026, with hover values and percentages. Data: Salary – Amara $4,850; Salary – Jonas $3,920; Freelance $640; Interest & dividends $110. Housing $2,850; Food $1,280; Transport $720; Childcare & education $1,150; Health $420; Lifestyle $640; Savings & investing $2,180; Giving $280.
Make it yours
- Change the details in the prompt to fit finance & households.
- For example, change it so that it shows a freelance photographer's annual business revenue from weddings, brand shoots and print sales instead of a household budget and the destination categories are Studio rent, Gear, Marketing, Taxes and Owner pay, shown for 2026 in a teal and gray palette.
- Ask for edits in plain words: tone, colors, length, layout or data.
- Share the result by link or export it when you are done.





