
Visualization template · Music fans & creators
Music chart race
Songs racing up the charts week by week. Made from one message, so you can get your own in minutes.
Music chart race
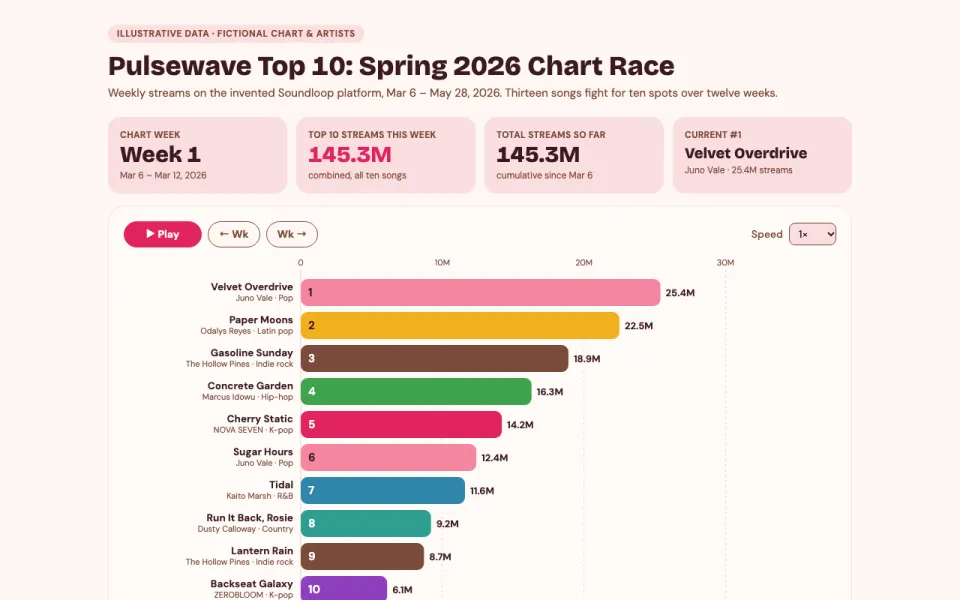
Songs racing up the charts week by week
The prompt
Create an animated bar chart race visualization of the top 10 songs on a fictional streaming chart called Pulsewave Weekly Top 10 on Soundloop over 12 weeks, with play/pause, a week slider, artist colors and a total streams counter. Use invented artists, including K-pop acts.
Make it yours
- Change the details in the prompt to fit music fans & creators.
- For example, change it so that the chart is a Latin and Afrobeats club chart with a top 15 and it runs for 20 weeks starting in September 2026.
- Ask for edits in plain words: tone, colors, length, layout or data.
- Share the result by link or export it when you are done.





