
Visualization template · Real estate agents & buyers
Home prices by neighborhood
Compare areas at a glance. Made from one message, so you can get your own in minutes.
Home prices by neighborhood
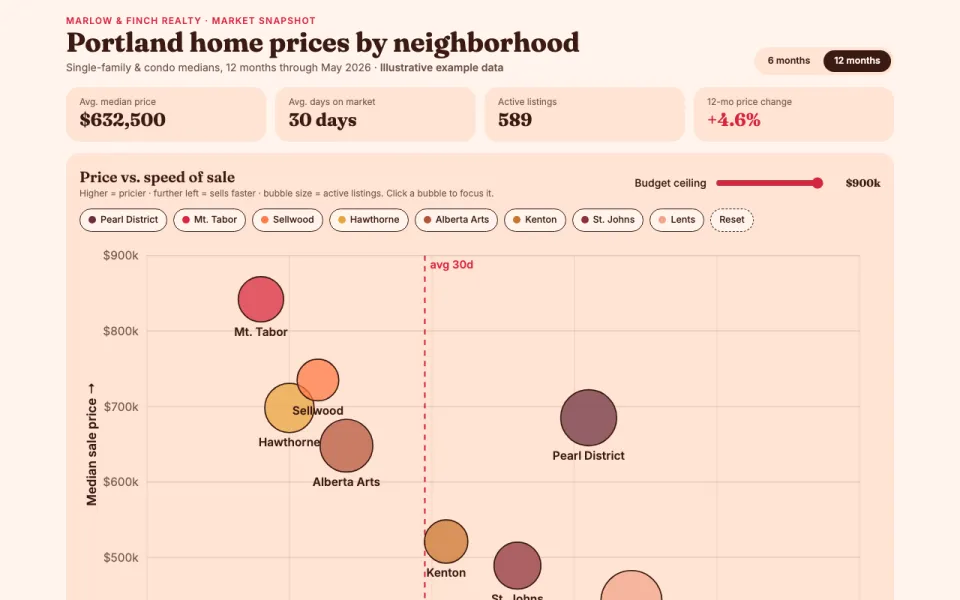
Compare areas at a glance
The prompt
Create an interactive chart comparing home prices across Pearl District, Mt. Tabor, Sellwood, Hawthorne, Alberta Arts, Kenton, St. Johns and Lents in Portland, Oregon: a bubble chart of median price vs days on market (bubble size = listings), price trends over the last 12 months, and a sortable table. Data: illustrative example data.
Make it yours
- Change the details in the prompt to fit real estate agents & buyers.
- For example, change it so that it compares condo and townhome prices across eight Austin neighborhoods and the price trend covers the last 24 months.
- Ask for edits in plain words: tone, colors, length, layout or data.
- Share the result by link or export it when you are done.





