
Visualization template · Analysts & community builders
Network graph
How people or ideas connect. Made from one message, so you can get your own in minutes.
Network graph
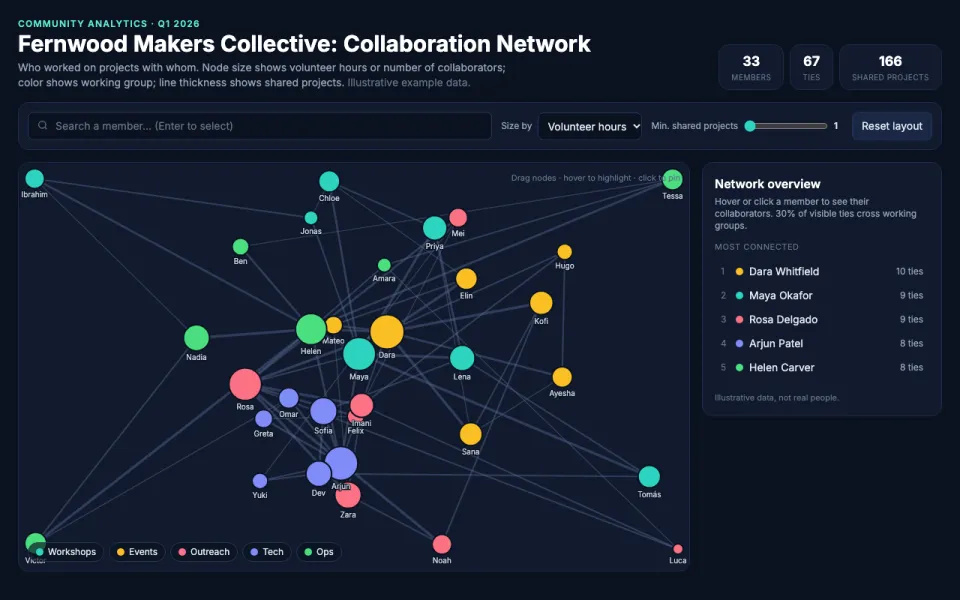
How people or ideas connect
The prompt
Create an interactive force-directed network graph visualization of who collaborated on projects with whom across the Fernwood Makers Collective, a 33-person volunteer community, in Q1 2026 with nodes sized by volunteer hours logged in Q1 2026 and colored by working group (Workshops, Events, Outreach, Tech, Ops). Drag nodes, hover to highlight neighbors, and search for a node. Data: example data of shared projects between members, where edge thickness reflects the number of projects two people worked on together.
Make it yours
- Change the details in the prompt to fit analysts & community builders.
- For example, change it so that the graph is for a 60-member alumni mentorship network at a design school showing who mentored whom during the 2026 spring term, with nodes sized by number of mentees and colored by graduation year.
- Ask for edits in plain words: tone, colors, length, layout or data.
- Share the result by link or export it when you are done.





