
Visualization template · Coaches & sports fans
Player season stats
Compare players across the season. Made from one message, so you can get your own in minutes.
Player season stats
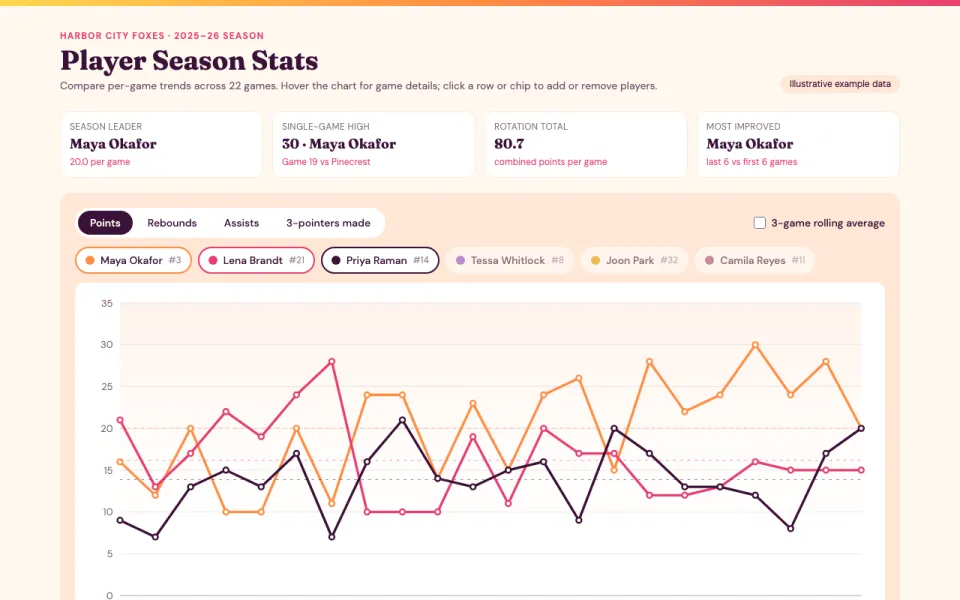
Compare players across the season
The prompt
Create an interactive chart of player stats for Harbor City Foxes women's basketball team in the 2025–26 season: per-game trend lines for points, rebounds, assists and three-pointers made, a player comparison selector, and a leaderboard table. Data: example data.
Make it yours
- Change the details in the prompt to fit coaches & sports fans.
- For example, change it so that it is for a youth soccer club's U14 squad in the fall 2026 season and the stats are goals, assists and shots on target.
- Ask for edits in plain words: tone, colors, length, layout or data.
- Share the result by link or export it when you are done.





