
Visualization template · Researchers & students
Population pyramid
Age and gender structure. Made from one message, so you can get your own in minutes.
Population pyramid
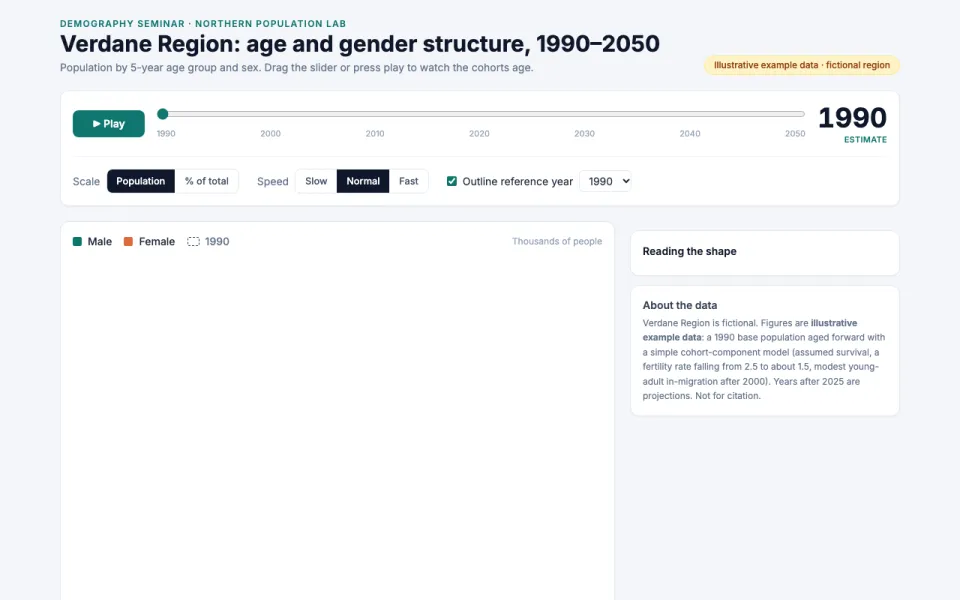
Age and gender structure
The prompt
Create an interactive population pyramid chart for Verdane Region (a fictional coastal region used in a university demography seminar) by age group and gender, with a year slider between 1990 and 2050 that animates the changes. Data: illustrative example data, labeled as such.
Make it yours
- Change the details in the prompt to fit researchers & students.
- For example, change it so that it shows a fictional mountain province called Karst Valley with 5-year age groups up to 85+ and the slider runs from 2000 to 2040 with a play button and a note that the figures are made-up teaching data.
- Ask for edits in plain words: tone, colors, length, layout or data.
- Share the result by link or export it when you are done.





