
Visualization template · Restaurants
Restaurant sales by hour
Busy times and best sellers. Made from one message, so you can get your own in minutes.
Restaurant sales by hour
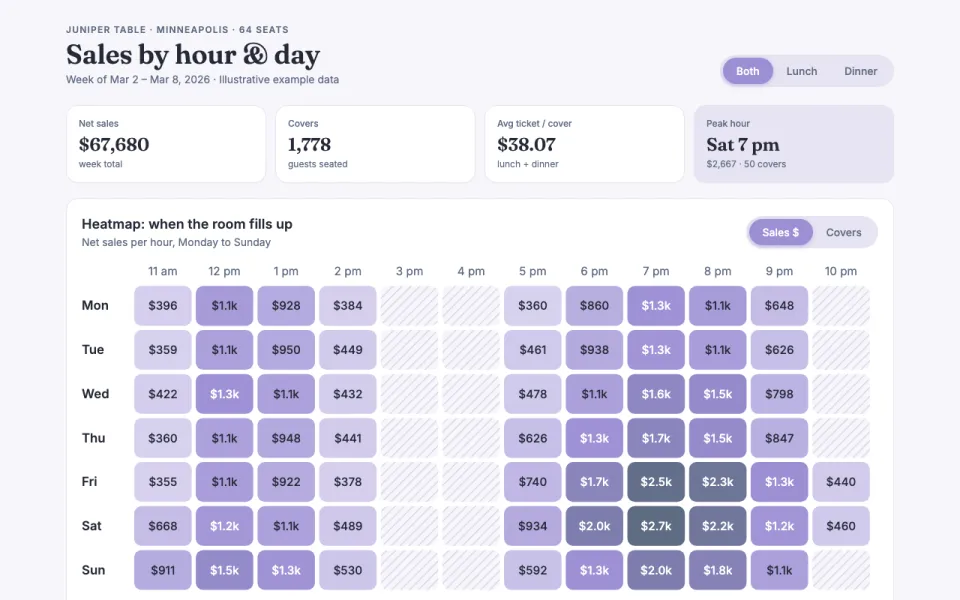
Busy times and best sellers
The prompt
Create an interactive dashboard chart for Juniper Table, a 64-seat neighborhood bistro in Minneapolis showing sales by hour and day as a heatmap, covers per service, top dishes, and average ticket size, with a filter for lunch or dinner. Data: example data for one illustrative week (Mon–Sun, 11 a.m. to 11 p.m.).
Make it yours
- Change the details in the prompt to fit restaurants.
- For example, change it so that it is for a 120-seat taqueria in Austin with a late-night service and the heatmap shows tickets per hour instead of sales dollars.
- Ask for edits in plain words: tone, colors, length, layout or data.
- Share the result by link or export it when you are done.





