
Visualization template · HR & job seekers
Salary comparison
Pay ranges by role and level. Made from one message, so you can get your own in minutes.
Salary comparison
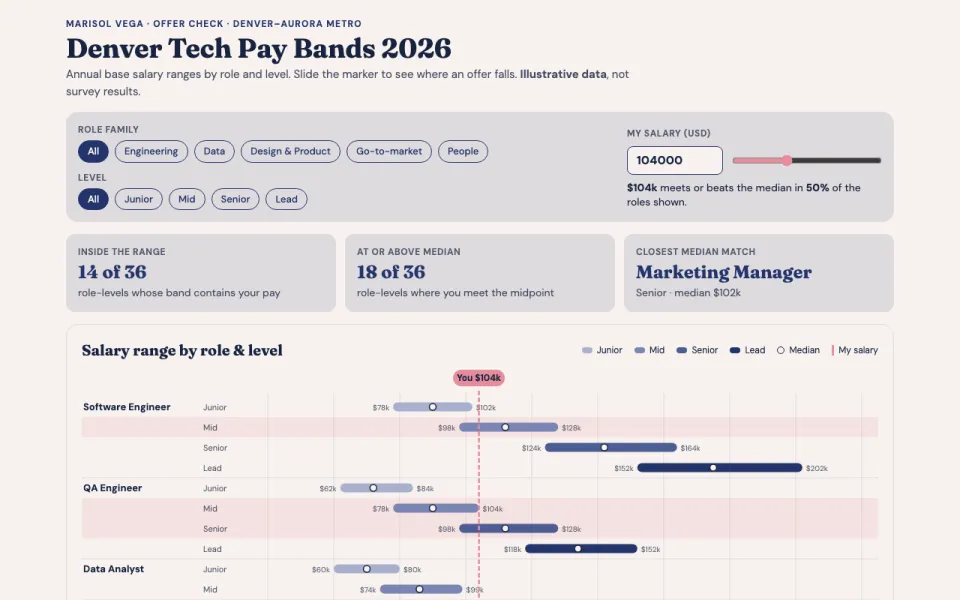
Pay ranges by role and level
The prompt
Create an interactive chart of salary ranges for software engineers, QA engineers, data analysts, data scientists, product designers, product managers, marketing managers, customer success managers and people partners in Denver, Colorado: range bars from low to high with the median by level, a filter by role family, hover tooltips, and a marker for $104,000 to see where it falls. Use illustrative data.
Make it yours
- Change the details in the prompt to fit hr & job seekers.
- For example, change it so that it covers nurses, care coordinators and clinic managers in Leeds, UK, priced in pounds and the marker is for a £42,000 job offer.
- Ask for edits in plain words: tone, colors, length, layout or data.
- Share the result by link or export it when you are done.





