
Visualization template · Logistics teams
Shipment tracker
Where every delivery is right now. Made from one message, so you can get your own in minutes.
Shipment tracker
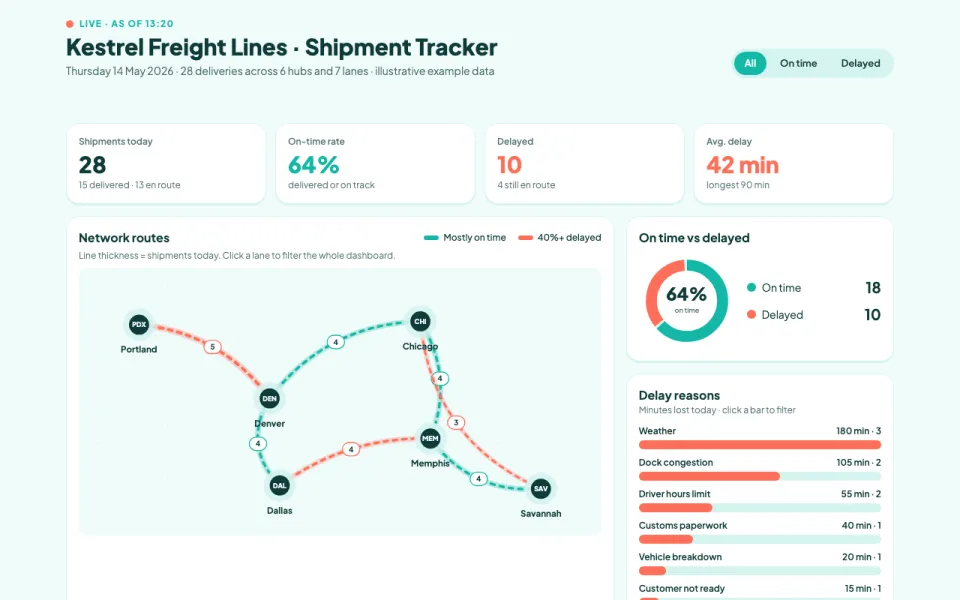
Where every delivery is right now
The prompt
Create an interactive dashboard visualization of shipments for Kestrel Freight Lines, a regional trucking carrier: a stylized route diagram between the Portland, Denver, Dallas, Chicago, Memphis and Savannah hubs, on-time vs delayed counts, a timeline of today's deliveries, and a delay-reasons breakdown. Data: example data for Thursday 14 May 2026, 28 shipments across 7 lanes, as of 13:20.
Make it yours
- Change the details in the prompt to fit logistics teams.
- For example, change it so that it tracks cold-chain pharmaceutical deliveries for a Nordic distributor between Oslo, Gothenburg, Copenhagen and Hamburg and the delay reasons include temperature alarms and customs holds.
- Ask for edits in plain words: tone, colors, length, layout or data.
- Share the result by link or export it when you are done.





