
Visualization template · Teachers
Class skill mastery
Who needs help with what. Made from one message, so you can get your own in minutes.
Class skill mastery
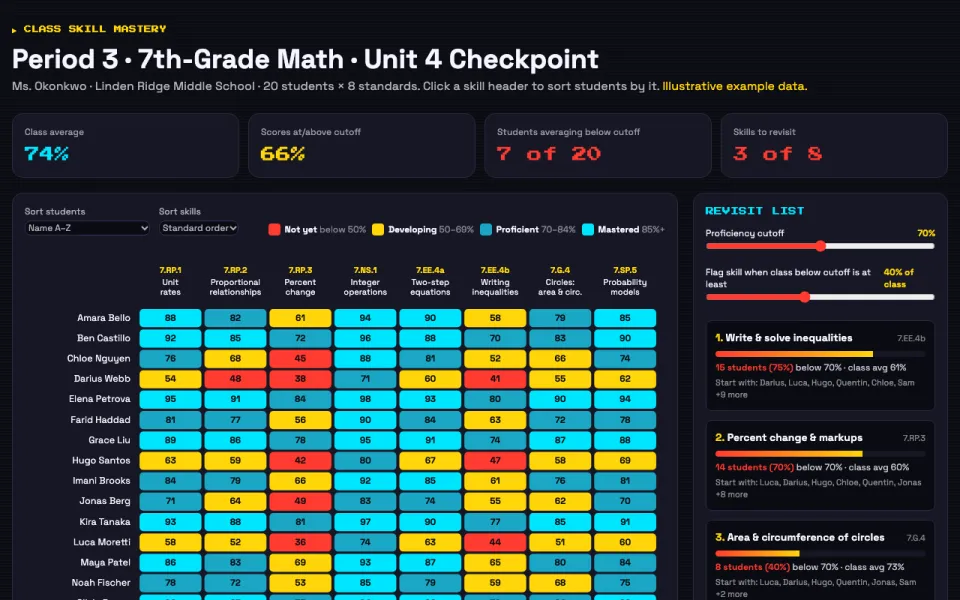
Who needs help with what
The prompt
Create an interactive heatmap chart of skill mastery for Ms. Okonkwo's Period 3 7th-grade math class (20 students) across eight 7th-grade math standards: unit rates, proportional relationships, percent change, integer operations, two-step equations, inequalities, circles, and probability, with students as rows, color by mastery level, sorting by student or skill, and a list of skills the class needs to revisit. Data: example data from the Unit 4 checkpoint quiz.
Make it yours
- Change the details in the prompt to fit teachers.
- For example, change it so that it is for a 10th-grade biology class tracking six lab-skill standards and mastery is scored on a 4-point rubric instead of percentages.
- Ask for edits in plain words: tone, colors, length, layout or data.
- Share the result by link or export it when you are done.





