
Visualization template · Engineering teams
Sprint burndown
Work left vs the ideal line. Made from one message, so you can get your own in minutes.
Sprint burndown
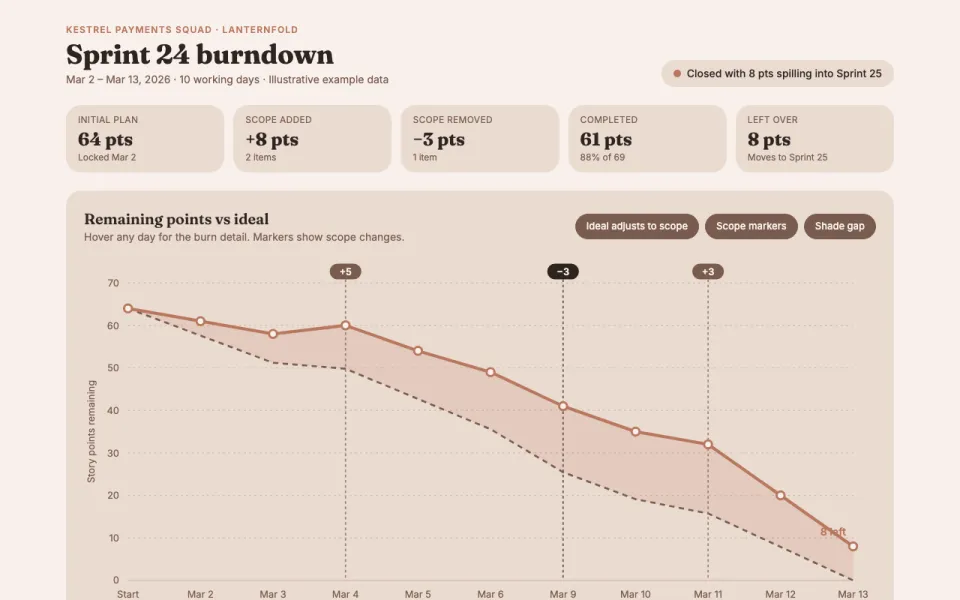
Work left vs the ideal line
The prompt
Create an interactive chart for Kestrel Payments squad's sprint 24: a burndown of remaining points vs the ideal line, scope changes marked, and a velocity bar chart for the last 6 sprints. Data: daily remaining story points for Mar 2–13, 2026, starting at 64 points, with +5 on Mar 4 (PCI tokenization fix), −3 on Mar 9 (refund CSV export deferred) and +3 on Mar 11 (webhook retry bug), plus committed vs completed points for sprints 19–24.
Make it yours
- Change the details in the prompt to fit engineering teams.
- For example, change it so that it is for a mobile app team running 14-day sprints with 40 points committed and the scope changes are two mid-sprint bug escalations.
- Ask for edits in plain words: tone, colors, length, layout or data.
- Share the result by link or export it when you are done.





