Visualization template · Retail & product analysts
Category sunburst
Drill through layers of a hierarchy. Made from one message, so you can get your own in minutes.
Category sunburst
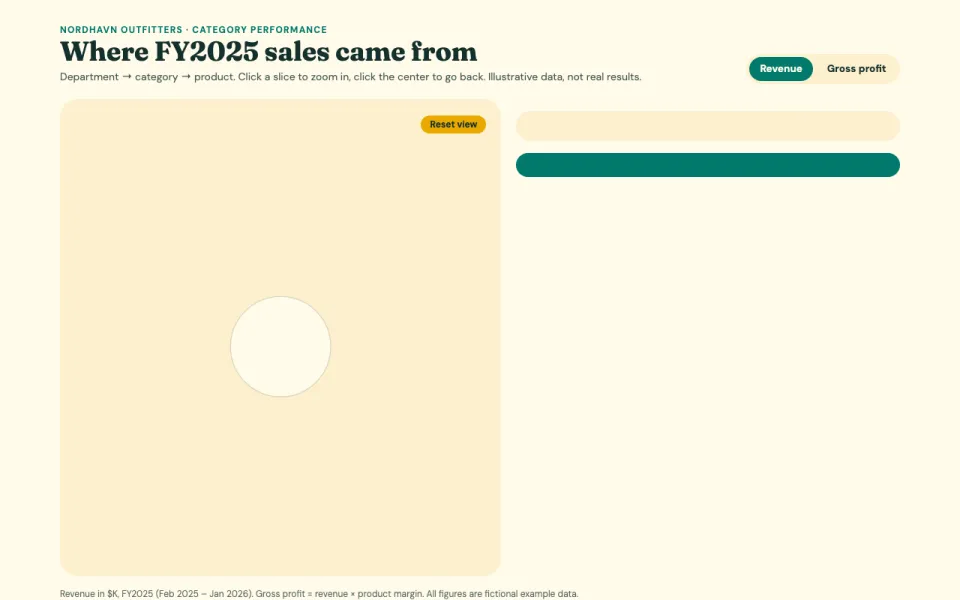
Drill through layers of a hierarchy
The prompt
Create an interactive sunburst chart of Nordhavn Outfitters' FY2025 store sales by department, category and product: rings for each level sized by value, click a slice to zoom in, hover for value and share, and a center label that shows the current level. Data: example data (illustrative FY2025 revenue in $K and gross margin % for 5 departments, 15 categories and 45 products).
Make it yours
- Change the details in the prompt to fit retail & product analysts.
- For example, change it so that it is for a regional pharmacy chain's front-of-store sales by aisle, category and brand and the toggle compares units sold instead of gross profit.
- Ask for edits in plain words: tone, colors, length, layout or data.
- Share the result by link or export it when you are done.