
Visualization template · Researchers & HR
Survey results
Charts for every question. Made from one message, so you can get your own in minutes.
Survey results
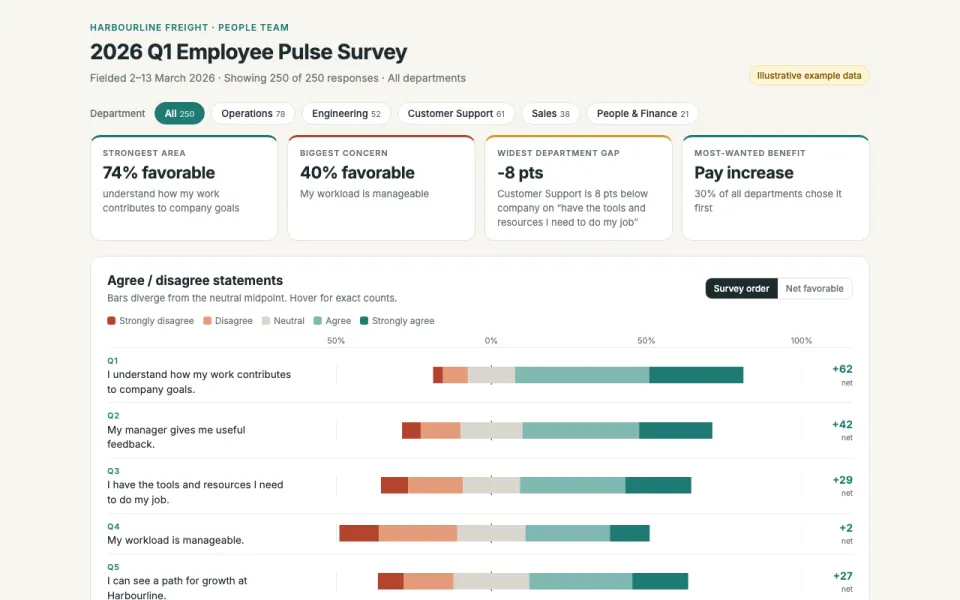
Charts for every question
The prompt
Create an interactive visualization of survey results for the Harbourline Freight Q1 2026 Employee Pulse Survey with 250 responses: a chart per question (bars for choices, a diverging chart for agree/disagree scales), a filter by department (Operations, Engineering, Customer Support, Sales, People & Finance), and key takeaways at the top. Data: example data.
Make it yours
- Change the details in the prompt to fit researchers & hr.
- For example, change it so that it is for a university research team's 2026 student wellbeing survey with 480 responses, the filter is by year of study (First year, Second year, Third year, Postgraduate) and the diverging charts use a teal and orange palette.
- Ask for edits in plain words: tone, colors, length, layout or data.
- Share the result by link or export it when you are done.





