
Visualization template · DevOps & IT
Service status & uptime
A status page for your systems. Made from one message, so you can get your own in minutes.
Service status & uptime
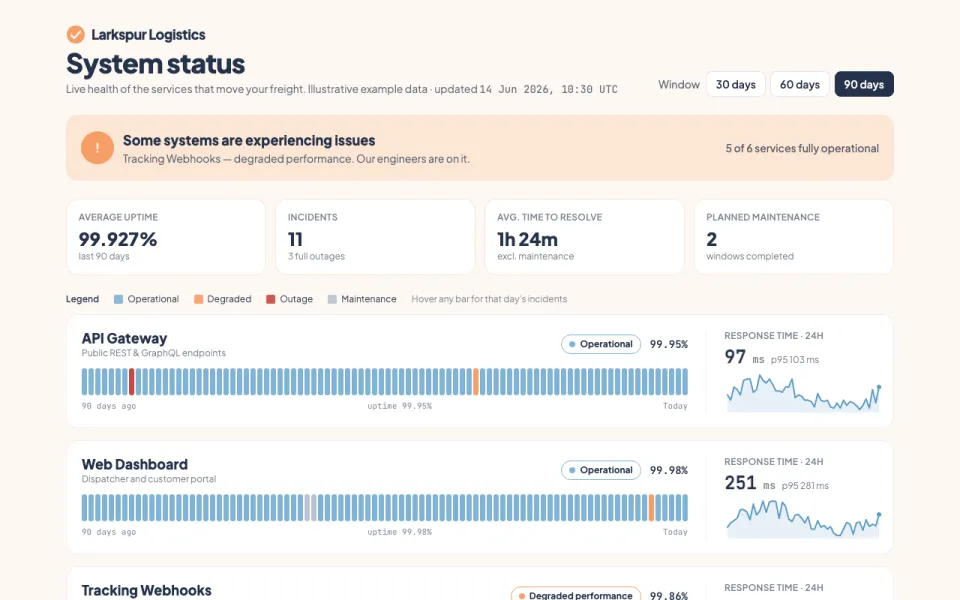
A status page for your systems
The prompt
Create an interactive status dashboard visualization for Larkspur Logistics' six production services (API Gateway, Web Dashboard, Tracking Webhooks, Payments, Notifications, Route Optimizer): 90-day uptime bars per service with incidents on hover, current status badges, response-time sparklines, and an incident history list. Data: example data covering 12 incidents between March and June 2026, including one ongoing webhook delay.
Make it yours
- Change the details in the prompt to fit devops & it.
- For example, change it so that it shows the services of a telehealth booking app with video visits, e-prescriptions and appointment reminders and the incident data comes from a quarterly postmortem spreadsheet I paste in.
- Ask for edits in plain words: tone, colors, length, layout or data.
- Share the result by link or export it when you are done.





