
Visualization template · Everyone
Weather dashboard
A week of forecast at a glance. Made from one message, so you can get your own in minutes.
Weather dashboard
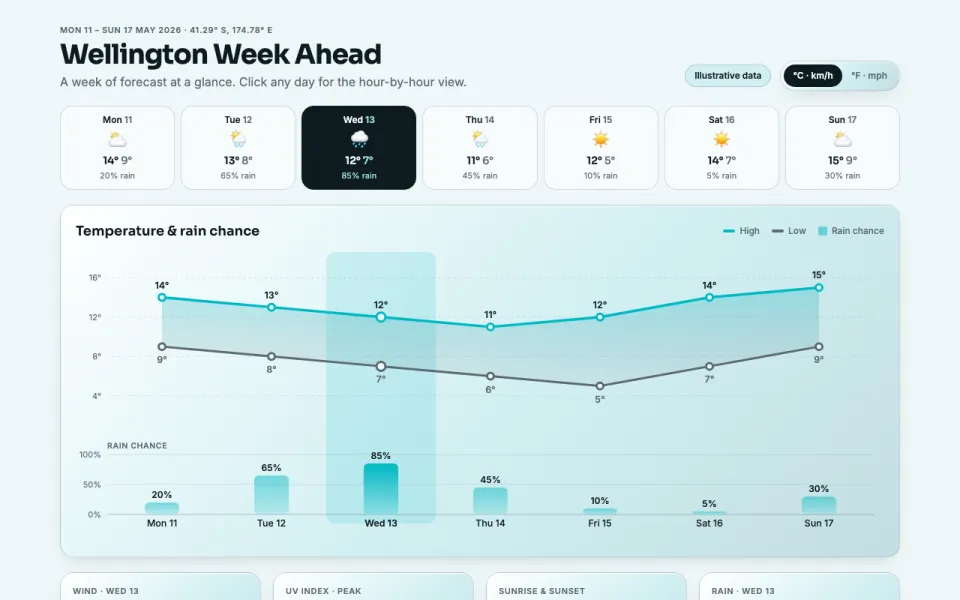
A week of forecast at a glance
The prompt
Create an interactive dashboard chart for the weather in Wellington, New Zealand over the next 7 days: a temperature line with highs and lows, rain chance bars, wind and UV cards, sunrise and sunset, and an hour-by-hour view when I click a day. Use illustrative data.
Make it yours
- Change the details in the prompt to fit everyone.
- For example, change it so that it covers Chicago in late July with a heat-index warning and temperatures are shown in °F with thunderstorm chance instead of rain.
- Ask for edits in plain words: tone, colors, length, layout or data.
- Share the result by link or export it when you are done.





