
Visualization template · Sports fans & analysts
Match win probability
How a game swung, play by play. Made from one message, so you can get your own in minutes.
Match win probability
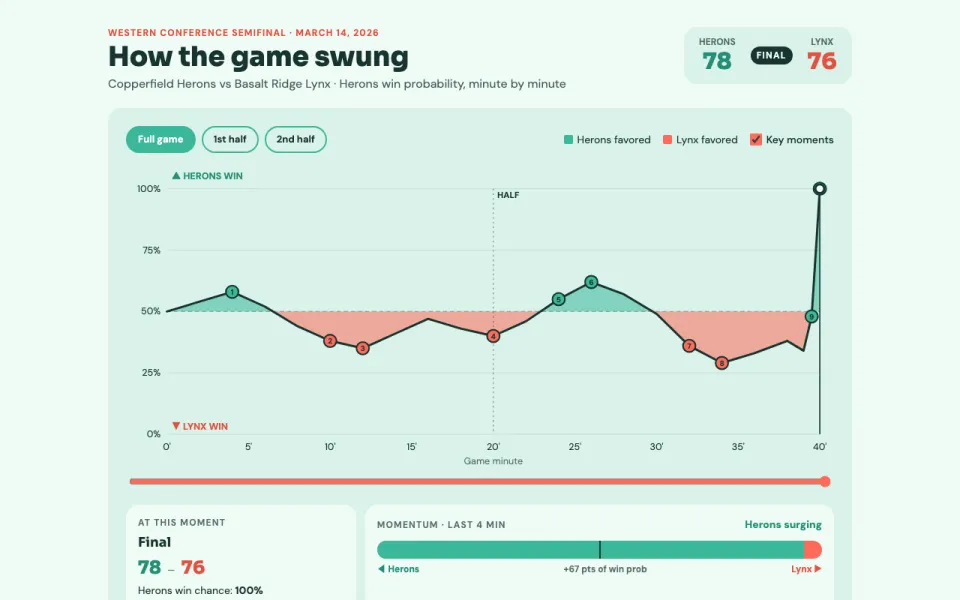
How a game swung, play by play
The prompt
Create an interactive chart of win probability over time for a basketball match between Copperfield Herons and Basalt Ridge Lynx: a line that swings between the teams, markers for key moments with hover descriptions, the final score, and a momentum bar. Use illustrative data.
Make it yours
- Change the details in the prompt to fit sports fans & analysts.
- For example, change it so that it covers a rugby union final between two club sides and the key moments are tries, red cards and conversions, with the momentum bar showing the last 10 minutes.
- Ask for edits in plain words: tone, colors, length, layout or data.
- Share the result by link or export it when you are done.





