
Visualization template · Teachers & analysts
World data map
Color countries by any number. Made from one message, so you can get your own in minutes.
World data map
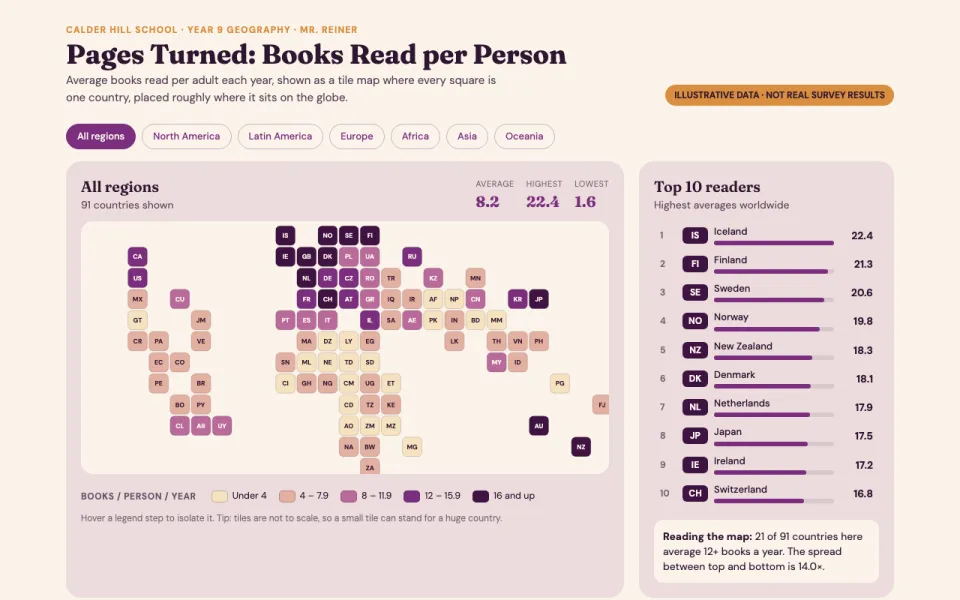
Color countries by any number
The prompt
Create an interactive world map visualization coloring countries by books read per person per year using illustrative data, with a color legend, hover tooltips with the value, a region filter, and a ranked top-10 list beside the map. Draw the map with simplified SVG shapes.
Make it yours
- Change the details in the prompt to fit teachers & analysts.
- For example, change it so that it colors countries by renewable electricity share of the grid, in percent and the region filter also includes a Caribbean group.
- Ask for edits in plain words: tone, colors, length, layout or data.
- Share the result by link or export it when you are done.





